- GBPUSD is one of the strongest performers in today’s trading despite news of lockdowns in some parts of the UK being reimposed.
GBPUSD is one of the strongest performers in today’s trading. The currency pair is second only to EURUSD in terms of gains. As of this writing, GBPUSD is up by 0.30% as it trades around 1.3134. This comes despite lockdowns in some parts of the UK being reimposed, namely: Greater Manchester, East Lancashire, and parts of West Yorkshire.
The weakness of the US dollar seems to be brought about by the lack of significant developments surrounding the country’s next stimulus bill. The US Senate is still in a deadlock regarding the next round of stimulus by the government as part of its Covid-19 recovery plan. This seems to be weighing down on the USD.
Technical Analysis
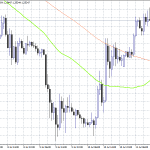
On the weekly time frame, it can be seen that GBPUSD is testing a major resistance level. By connecting the highs of June 14, August 23, April 8, and December 8, it can be seen that the currency pair is trading at the falling trendline. Reversal candlesticks around its currency price, 1.3130, may indicate a potential sell off soon.
On the other hand, a strong bullish close above the trendline around 1.3270 could mean that GBPUSD may soon retest its December 15 highs at 1.3513. If resistance at this level does not hold, we could soon see the currency pair go all the way up to 1.4333 where it peaked on April 18, 2018.

GBPUSD, Weekly Chart
