The GBP/USD price is in a tight range as investors shift from last week’s UK economic data to the upcoming Federal Reserve decision, consumer confidence, and GDP data. It is trading at 1.1986, which is slightly below last week’s high of 1.2067.
Fed decision ahead
The GBP to USD exchange rate will be in the spotlight this week as investors move after last week’s data from the UK. The numbers revealed that the country’s consumer inflation surged to 9.1% in June, its highest in over three decades.
Additional numbers revealed that the country’s unemployment rate remained at 3.7%, signalling that the labor market is strong. Finally, on Friday, data by the ONS revealed that the country’s retail sales declined sharply in June.
The next key catalysts for the GBP/USD will be from the United States. On Tuesday, the Conference Board will release the latest consumer confidence data. Analysts expect that confidence declined slightly in July as gas prices pulled back. In addition, the US will also publish the latest new home sales data.
The main game in town will be the upcoming interest rate decision by the Federal Reserve. Analysts expect the bank to hike interest rates by 0.75% for the second consecutive month. This means the bank will have hiked by 225 basis points this year, the most hawkish pace in decades.
Finally, the US will publish the latest GDP and PCE data on Thursday and Friday. Analysts expect the data to show that the economy slowed down in Q2 while PCE remained at an elevated level in June. PCE is the most important inflation data according to the Federal Reserve.
GBP/USD prediction
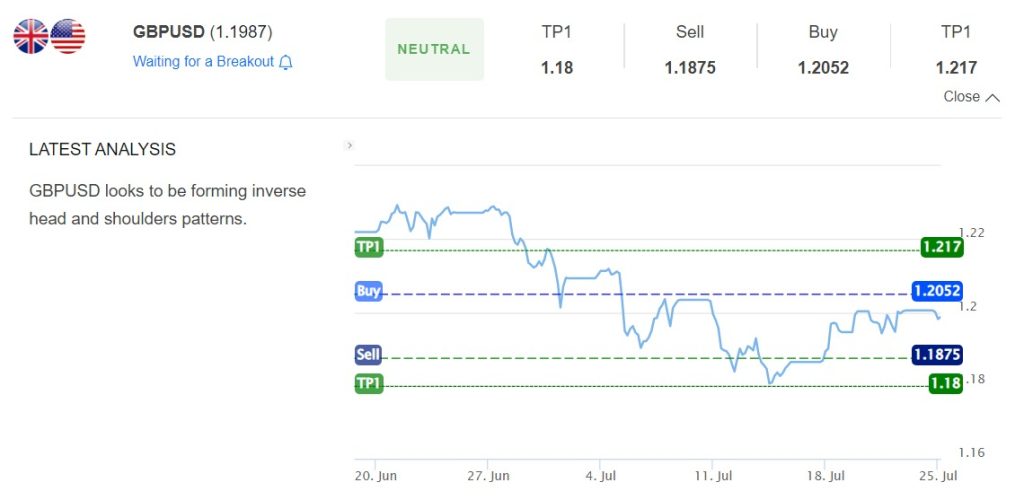
The four-hour chart shows that the GBP to USD pair is forming an inverse head and shoulders pattern. In price action analysis, this pattern is usually a bullish sign. It has moved slightly above the important 25-day and 50-day moving averages, while the Relative Strength Index (RSI) has moved below the neutral level.
Therefore, according to the highly recommended S&R indicator, the GBP/USD price will likely have a bullish break-out. This view will be confirmed if it moves above the important resistance level at 1.2047. On the other hand, a drop below the support at 1.1910 will invalidate the bullish view. Subscribe to the S&R indicator for a live forecast on popular forex pairs, indices, and cryptocurrencies.