

- GBP/USD has broken above its 200 MA. If the bulls gain strength, pound may continue to rally for the rest of this month.
GBP/USD is looking very bullish as the downtrend in the dollar strength index seems to be getting intense. The cable pair refreshed its two-month highs on Monday as the DXY index slid 0.16%. At press time,the British pound to US dollar rate was up 0.16%.
In addition, the pair was also trading above its 200-daily moving average during its New York session on Monday. The outlook is looking more bearish considering the cooling down inflation in the US and UK.
The US dollar also slid against Euro and Russian ruble on the first trading day of the week. However, it gained strength against the Canadian dollar and the Indian rupee. The latest analysis shows that the British point may have a short-term pullback before continuing upwards.

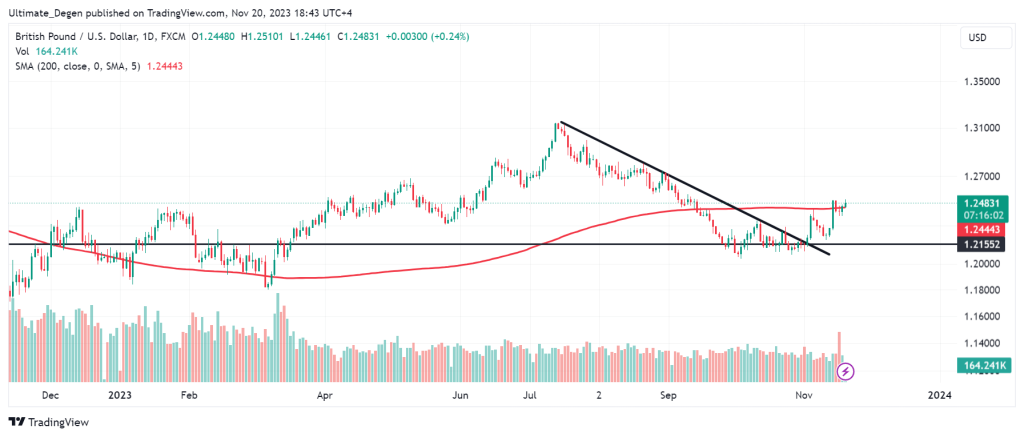
You know that I am a fan of timeframe analysis. Therefore, I have performed the technical analysis on the daily chart of GBP/USD. This shows that the pair is trying to gain strength above its 200 MA which lies at 1.2444. A breakout from this moving average will be very bullish.
I also analyze UK and US stocks on a higher timeframe, which you can find on my Twitter profile.