

- FTSE 100 has fallen agrressively in the last two trading days. With the index testing a major support level, can it recoup its losses?
FTSE 100 seems to be off to a better start in today’s trading than it has been these past couple of days. The UK’s stock index is up roughly 0.65% or 45 points at 6,979.0. However, there’s still a long trading day ahead. Can the FTSE 100 hold on to its gains?
That question can be answered by the market’s sentiment towards the coronavirus outbreak. Equities markets and other higher-yielding markets have been heavily-hit by risk aversion following news of the infection spreading outside of China. European stock markets have especially been vulnerable to selling because of the surge in coronavirus cases in Italy. The country reported 229 cases on Monday from previously being recorded at 3 the day prior. Investors are worried that the coronavirus would easily spread to other countries given how easy it is for people to move across Europe.
Governments have begun restricting travel in an effort to contain the infection. Unsurprisingly, cruise operator Carnival was the worst-performing stock in yesterday’s trading as it was down 5.92%. For today, however, some UK stocks are trading in the green with HSBC leading the way at +1.54%. It is then followed by Meggit at +1.03% and J Sainsbury at +0.59%.
Read our Best Trading Ideas for 2020.
FTSE 100 Outlook
On the monthly time frame of FTSE 100 CFDs, we can see that the stock index is testing support at the rising trend line (from connecting the lows of March 2009, February 2016, and March 2016). If February’s candle closes above the trend line, it could mean that there may still be buyers in the market.

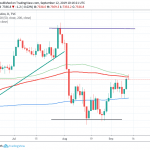
A closer look at the daily time frame shows that FTSE 100 could trade higher to near-term resistance at 7,157.7. This price served as a support level on October 2019 and December 2019. It also coincides with the area between the 23.6% and 38.2% Fib levels (when you draw the Fibonacci retracement tool from the high of February 12, 2020 and yesterday’s low).
However, if risk aversion continues to dictate trading for the rest of the week and FTSE 100 closes below the long term trend line, we could see a bigger sell-off. The next floor on FTSE 100 could be at 6,545.0 where it bottomed on January 1, 2019.