
- The FTSE 100 price index has seen its earlier gains erased after a poor performance from the top mining stocks.
The FTSE 100 price index is only marginally higher this Wednesday on a day that has produced muted trading action. The FTSE 100 is currently up 0.05% after some of the year’s best performers were offered by traders intent on banking some profits. The FTSE 100 was up by as much as 35 points in the session. However, the poor performance of the mining stocks has undermined any gains made by the bulls.
Shares of Rio Tinto, Glencore, and Anglo American are leading the losers’ chart on the day, losing 5.45%, 4.26%, and 3.72%, respectively. Ocado and BHP complete the top 4 losing stocks on the FTSE 100 index. However, the losses sustained in the mining stocks were enough to neutralise the gains made by stocks such as Draktrace, CRH, Experian, and Ashtead Group, gaining 6.38%, 4.68%, and 3.80%, and 3.59%, respectively.
Hikma Pharmaceuticals PLC could not gain much upside traction despite the award of preliminary approval from the US Federal Trade Commission for its planned purchase of Custopharm Inc.
Further fundamental drivers that are expected for the FTSE 100 price index later in the week include the UK retail sales and the flash PMI data for the manufacturing and services industries. Both data sets are due for release on Friday.
With UK consumer inflation still at 30-year highs, the retail sales data will indicate whether consumers are now spending less at retail outlets because of higher costs or not. However, the market is not expecting a change in the figures from last month.

FTSE 100 Price Index Outlook
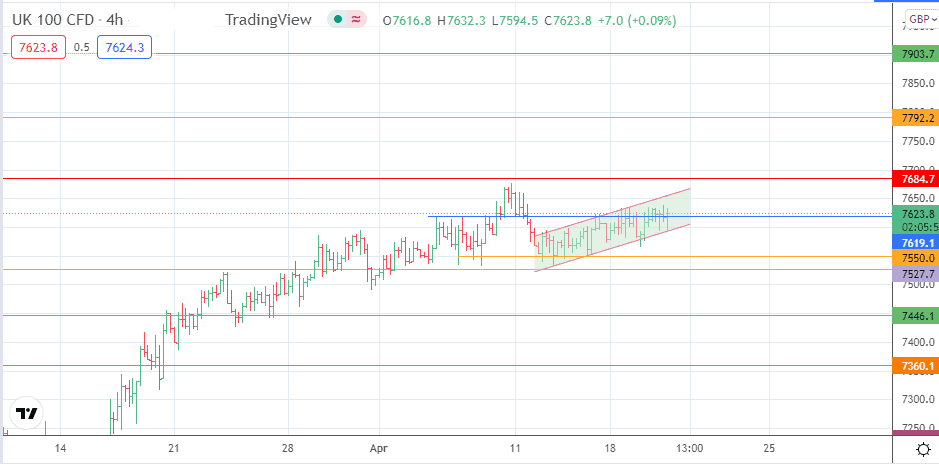
The intraday decline has broken the 7619.1 support line, but the move met an obstacle at the channel’s lower border from where a price bounce occurred. This bounce has met resistance at 7619.1, now acting as new resistance. If the bears can force a breakdown move from this point, the next target to the south will be at 7550.0 (14 April 2022 low). Below this level, 7527.7 and 7500.00 are the immediate targets to the south before 7446.1 enters the picture (25 March 2022 low).
On the flip side, a break above the 7619.1 price mark leaves the channel’s return line vulnerable. If this line gives way, 7684.7 (10 February 2022 high) becomes a new target to the north. Additional upside targets are found at the 7792.2 resistance mark and the 7903.7 barrier (21 May 2018 high).
FTSE 100: 4-hour Chart
Follow Eno on Twitter.