

- FTSE 100 Index Forecast: The UK shares are showing a recovery this week due to cooling down inflation in the eurozone and bets on earlier rate cuts.
The FTSE 100 index had a very strong rebound on Thursday as the benchmark index gained 60 points. The recovery seems to be fuelled by rising energy stocks and the cooling down of inflation in the eurozone. At press time, the benchmark tracking the most valuable UK stocks stood at 7,467 points, after a slight correction from the 7,498 level.
The ongoing positive sentiment in the UK and European shares can be attributed to the recently released inflation numbers of Spain and Germany. These stats have strengthened the belief in rate cuts next year.
Another factor contributing to the recovery is the rise in global oil prices. This caused the energy stocks, which are a significant chunk of the FTSE 100 index, to inch higher. However, the index still remained well below the monthly highs of 7,534 points.

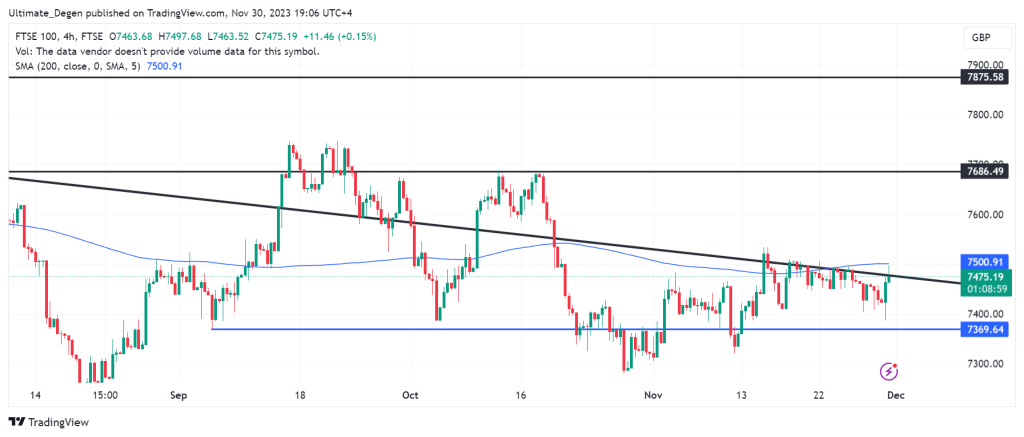
Moving on to the technical analysis, the black lines on the following chart are the horizontal and diagonal resistances for the FTSE 100. The black lines on the following chart are the horizontal and diagonal resistances for the FTSE 100. On a 4H timeframe, you can clearly see the index struggling to break out of the downward trendline which is acting as a diagonal resistance.