

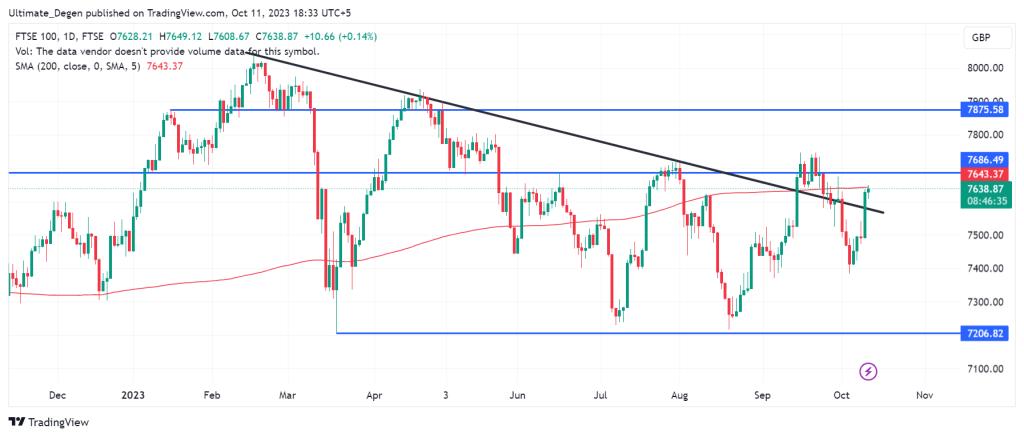
- FTSE 100 index is retesting the 200MA after a major breakout from the downtrend. Bulls are eyeing the 7,875 level next.
FTSE 100 Index edged up slightly higher on Wednesday due to the recent recovery in the stock prices of oil and utility companies. A look at the chart shows the benchmark index has been in a bullish trend since last week and currently sits 0.4% above its last week’s lows.
The recent positive remarks made by the Bank of England may also be the reason why UK stocks are riding a bullish wave. The British central bank confidently expressed the resilience of the UK economy against any financial shocks. It also mentioned UK banks are “strong enough to support households and businesses” if the economic conditions worsen.
Why is The FTSE 100 Index Up Today?
As the world anticipates a supply shortage for oil, the stocks of oil and gas companies operating in the UK are on the up. The FTNMX601010, which is an oil and gas benchmark, is up 1% due to the ongoing conflict in the Middle East.
The British labor market appears to be cooling off as UK employers reduce job vacancies for the first time in over two and a half years. The FTSE 100 index, which is a performance benchmark of the top 100 companies operating in the UK, is down 5% from its yearly peak of 8,050 points.

FTSE Chart
FTSE 100 Index Forecast
On the daily timeframe, the benchmark index has broken out above the downward trendline. On Wednesday, the benchmark index is retesting the 200 MA, which lies at 7643 points. A closer look at the following chart also reveals the formation of the descending triangle pattern. I expect the price to make a move towards 8300 points if the index breaks above the 7,640 points resistance and holds.
The chart below also shows a critical resistance level of 7,640 points. In case of a break above this resistance level, the FTSE 100 forecast will flip bullish, and the index will make its way toward the 7875-point resistance level. However, this bullish scenario will be invalidated if the index breaks back under the downward trendline due to a fakeout.