


- FTSE 100 Index forecast is still bearish as the British benchmark heads towards 7,200 support. Here's my next target.
FTSE 100 Index appears to be consolidating near its monthly lows after receiving an intense rejection from the 7686-point resistance level. This recent dip in the UK stock market can be attributed to investors dumping their shareholdings in favor of safer investment opportunities.
On Thursday, the FTSE 100 lost 20 points as the conflict in the Middle East lingered on. Last week, the retail sales in the UK also declined by 0.9%. This suggested that the British people mostly refrained from spending on non-essential items amid the high cost of living.
On Wednesday, the UK stocks were dragged down by disappointing Q3 earnings results from Standard Charted due to its exposure to the Chinese real estate market. Alongside the British bank, Unilever also reported a significant decline in its third-quarter sales figures amid high inflation. There was also some bearish pressure from overseas as Alphabet Inc. reported underwhelming earnings results.
The markets anticipate another pause in rates by the Bank of England in the meeting next week. This prediction is bolstered by the weak PMI data which suggested that the UK economy appears to be cooling down a bit. A pause in rate hikes might ease the ongoing downtrend in the FTSE 100 index.Side by side, the output growth expectations for the UK tumbled to their lowest levels since December 2022 as business and consumer spending declined.

FTSE 100 Index Forecast
My bearish scenario for FTSE 100 index has come into play as the index broke below the 7380 points level. The next major support that the bears are likely to target is the 7200 points level which lies 2.3% below the current levels.
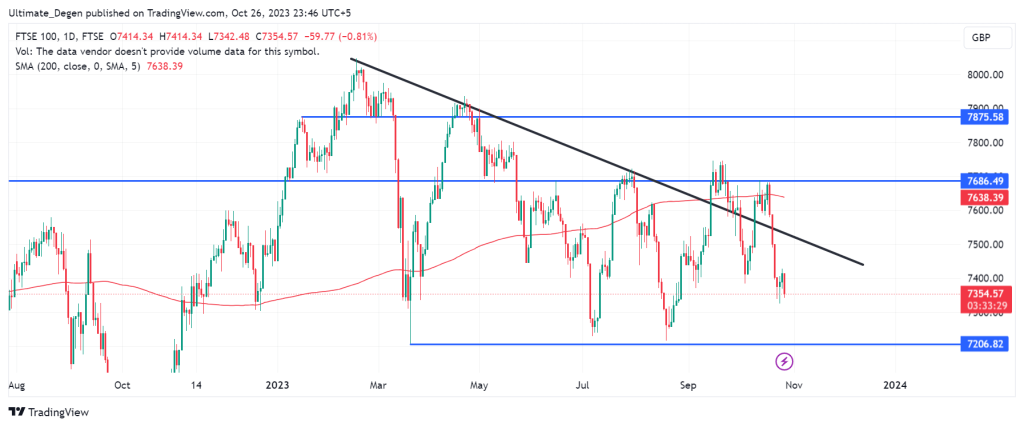
However, the above-mentioned FTSE 100 index forecast will be invalidated if the bulls orchestrate a breakout from the toward trendline. The downward trendline is a critical dynamic resistance as it also has confluence with the 200 MA on the daily chart.