

- FTSE 100 trades slightly lower as the index digest the strong rebound from yesterday’s trading session. FTSE 100 managed to rebound yesterday
FTSE 100 trades slightly lower as the indexdigest the strong rebound from yesterday’s trading session. FTSE 100 managed to rebound yesterday after tested the 100-day moving average. Earlier today we had positive news from the UK economy. The Retail Sales registered in at 0.9% topping the forecasts of 0.7% in January. The retail sales yearly reading, came in at 0.8% also beating the estimates of 0.7%. Retail sales ex-fuel came in at 1.6% above the market consensus of 0.8%.
Investors sentment helped today by the PBOC new measures that announced in the morning. The central bank of China cut the benchmark one-year prime rate by 10 bps, to 4.05% from 4.15%, and the five-year prime rate by 5 bps to 4.75% from 4.80%. Also yesterday the PBOC cut the one-year medium-term lending rate to 3.15% from 3.25%.
Read our Best Trading Ideas for 2020.
FTSE 100 Trapped Between the 50 and 100-day Moving Average
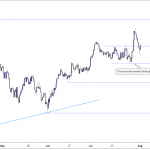
FTSE 100 is 0.07% lower at 7459 as the index consolidate yesterday’s gains. The technical outlook for the FTSE 100 index is neutral as the benchmark hovering between the 50 and 100-day moving average.

On the downside now, immediate support for the index stands at 7446 the daily low. If the index breaks below, the next support area is at 7388 the 100-day moving average. A convincing break below might target the low from February 18th at 7350.
On the other side, first hurdle for the FTSE 100 index stands at 7,475 the daily high. The next resistance for the index is at 7508 the 50-day moving average. In case of a bullish breakout might test the high from February 12th trading session at 7547.