


- The FTSE 100 forecast for March 2022 is for the index to face severe pressure as investors bail out of sanctions-hit stocks.
Any FTSE 100 forecasts for a positive start to the month are quickly fading away in the wake of steep drops that geopolitical factors have precipitated. The FTSE 100 was dragged down on Thursday by shares of Polymetal and ITV, which both fell 45.75% and 35.78%, respectively. Polymetal is exposed to the Russian market, selling gold to Russian banks.
It is feeling the impact of sanctions placed against Russian economic interests. Polymetal has tumbled nearly 80% since Monday, especially after Norway’s sovereign wealth fund said it would sell off all its positions on Russian investments in support of Ukraine. The losses will see Polymetal delisted from the FTSE 100 on Monday, 7 March.
Commodity company Evraz is also set to lose its FTSE 100 status after falling 13.76% on Thursday to take the 4th spot in the losers’ chart. This week, the Russian mining firm has lost more than half of its market value as investors clear out of their positions on Russian-exposed firms.
The FTSE 100 index has a heavy commodity tilt, and several of the big-name commodity companies listed on the index are exposed to Russia somehow. The FTSE 100 forecast for March 2022 indicates that the index faces severe pressure as sanctions-hit companies see investors sell off their holdings aggressively. The 2.62% drop in the FTSE 100 on Thursday may be one of several huge bearish days to come.
FTSE 100 Forecast
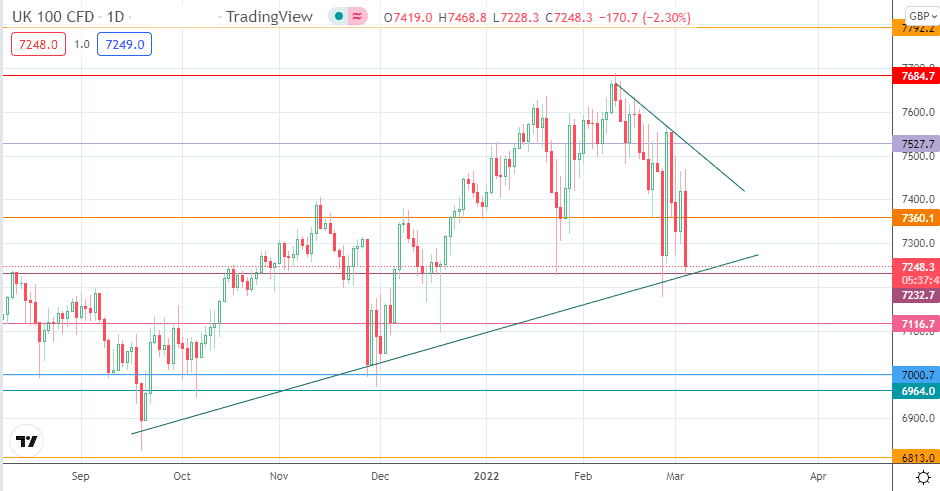
The steep decline in the FTSE 100 index on Thursday has set up a challenge with the 7232.7 support line. If the bears degrade this support level and the ascending trendline, which connects the lows of 20 September/1 December 2021 and 24 February 2022, we could see the drop extending towards 7116.7 initially. Below this level, psychological support is seen at 7000.7 (also 19 August and 26 November 2021 lows), before 6964.0 and 6813.0 (13 May and 19 July 2021 lows) enter the mix as additional downside targets.

On the other hand, a bounce on the ascending trendline/7232.7 support sends the price activity towards the 7360.1 resistance. The descending trendline that connects the 11 February to 28 February lows comes up as another barrier immediately before any price advance sets up a meeting with 7527.7. The 7684.7 resistance barrier lines up as yet another barrier to the north, last seen as a double top on 26 December 2019 and 20 January 2020.
FTSE 100: Daily Chart
Follow Eno on Twitter.