- The article highlights the current movements in major forex pairs, focusing on USD/CAD, GBP/JPY and EUR/JPY.
- It provides a price forecast for each currency pair and insights on trends.
Identifying which currency pairs are active is essential for traders to help focus on the best opportunities. Traders often look for pairs with high volatility to time their entries more effectively. This article breaks down which forex pairs are moving right now and the factors driving them.
GBP/JPY Price Forecast: Bulls Remain in Control
The GBP/JPY has opened the week with great momentum. The currency pair is eyeing the 209.00 level after a successful close above 207.35. The price is clearly trading inside an ascending channel on the 1-hour daily chart. The price action forms higher highs and higher lows, indicating bullish momentum.
The GBP/JPY bulls remain in control above the key resistance at 206.18, the low of Friday, where the currency pair bounced above and successfully breaks above 207.35, eyeing 209.00.
The Bollinger bands are widening, indicating increasing volatility, and support the bullish scenario. Now, the price is slightly outside the upper band, which is typical of strong uptrends. This signals strong buying pressure. However, we could see a near short-term correction, just a reversion to the middle band (20-period SMA).
The RSI reads roughly 71.7, signaling overbought momentum. This confirms a near-term correction.
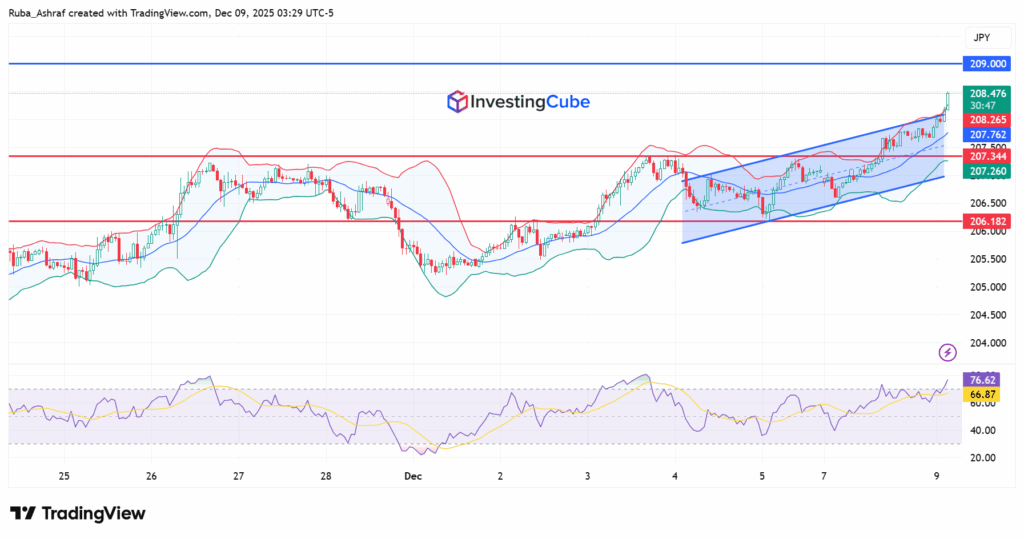
A sustained close above 208.19 could pave the way toward 209-210 levels, with pullbacks to the upper boundary of the channel at 207.70 offering safer long entries.
If price falls back inside the channel, breaking below 207.7, reaching 206.58, this means that the bullish trend weakens, and a deeper correction may begin. If RSI stays high and price remains overextended, wait for a retest before buying and place stops below the 20658 support area.
What is Lifting GBP/JPY Right Now?
The fundamentals are still supporting the pound. Market sentiment’s risk appetite is high as the UK’s recent tax-raising budget from Chancellor Rachel Reeves has eased worries about the country’s deficit. The has pushed investors to trust GBP and buy more.
USD/CAD Price Forecast: Trump’s Tariffs and Weaker Oil Prices Weigh on the Loonie
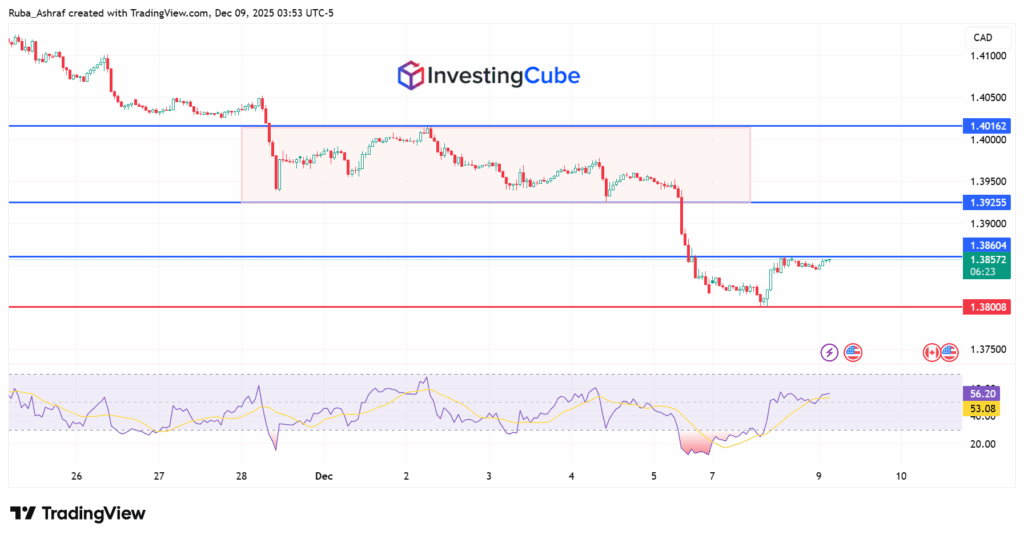
The price action shows that once the USD/CAD breaks below the rectangle pattern, the selling pressure becomes significant. It’s currently trading under the pressure of a strong resistance level of the lower boundary at 1.3925.
Moreover, bulls are losing their momentum below the resistance level of 1.3860. The price tested this level many times and failed to break through. The RSI indicator is sitting at 56.20 mark. This means that buyers and sellers are balanced. A fundamental catalyst is required to encourage the price to break through 1.3860. Until this happens, buyers and sellers are waiting for the key fundamental factors to shift momentum.
Key Factors Driving USD/CAD Weakness
- Canadian Employment Data: The figures released last Friday support a hawkish Bank of Canada, strengthening CAD.
- Trump’s Tariffs Threats: The potential tariffs on Canadian agricultural products limit CAD upside.
- Crude Oil Prices: Recent consolidation in oil prices after losses weakens CAD.
- US Federal Reserve Expectations: Rising bets on more rate cuts limit USD recovery, affecting USD/CAD.
- The divergence between BOC and Fed monetary policies creates uncertainty for USD/CAD bulls.
USD/CAD traders are watching the upcoming economic data:
- Bank of Canada policy update.
- FOMC rate decision.
- Tuesday’s US macro data: ADP Weekly Employment Change and JOLTS Job Openings.
EUR/JPY Price Forecast:
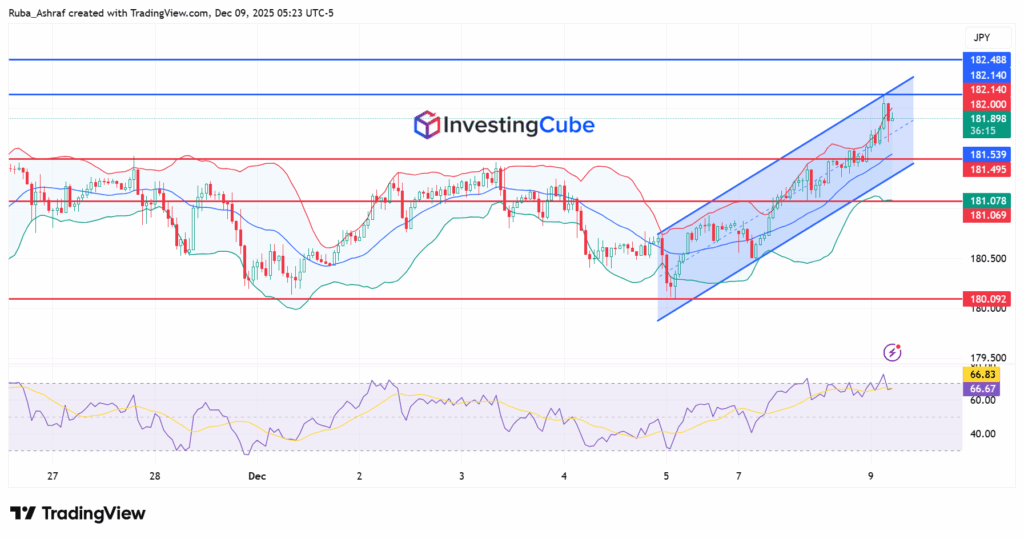
The price action shows that the EUR/JPY is moving within an ascending channel. The price tested the upper boundary of the ascending channel but failed to break through. This failure indicates that buying momentum is weakening, suggesting a bearish correction. A clear 1-hour close below the mid-line of Bollinger bands at 181.54 could pave the way towards 181.076.
The RSI indicator is sitting around 66.80, which is too near the 70.00 mark. This signals overbought conditions and confirms that EUR/JPY may go for a deeper correction before its reversal to retest the upper line of the channel at 182.140. A decisive daily close above 182.140 could pave the way toward 182.500.