
- The USD/INR remains range-bound, struggling to break above the 88.80 resistance, with technical indicators suggesting consolidation before any fresh directional move.
- Investors now await the Indian CPI data, a key figure that could influence the RBI’s next policy steps.
- On Friday, Foreign Institutional Investors (FIIs) turned net buyers, signaling renewed confidence in Indian markets despite global uncertainties.
The USD/INR consolidates above the 88.00 level, starting the trading week 0.04% higher. It trades under pressure of the strong resistance at 88.80. The support level at 87.72 is key in keeping the USD/INR consolidating above 88.00.
USD/INR struggles with the unclear direction of the US Dollar during the 40-day-long shutdown. There is a hope that the shutdown will end soon, with the first vote in favor of reopening.
The US Dollar Index trades flat at 99.61, with no clear direction. Meanwhile, there is a good sign that the shutdown will end soon. As President Donald Trump said:
It looks like we’re getting very close to the shutdown. We never agreed to give any substantial money, or any money to prisoners, illegals that come into our country, and i think that the Democrats understand that; and it looks line we’re getting close to the shutdown ending. You will know it very soon.
The US dollar’s struggle is weighing on the USD/INR path, while on the other hand, Indian factors such as Foreign Institutional Investors inflows & outflows, updates on the US-India talks, and India’s economic health are influencing the USD/INR. Therefore, the currency pair trades in a tight range until it finds a clear direction.
The Fundamental Drivers Influencing the USD/INR:
- Traders are waiting for the Indian consumer price index figures. It will be released on Wednesday. Due to a sustained fall in food prices, India’s retail inflation growth is expected to be 0.48% slower than the 1.45$ growth seen in September (YoY).
- If inflation continues to ease, it could raise bets that the Reserve Bank of India (RBI) will cut interest rates further this year. So far, the RBI has already lowered the Repo Rate by 100 basis points to 5.5%.
- On Friday, the FIIs were net buyers; they bought indian shares worth 4,581.34 crores. Even though there are no new trade talks between the US and India. In recent months, they had stayed away from Indian equities or even sold their investments, due to the US-India struggles in reaching an agreement, hurting India’s global trade competitiveness.
The Technical Outlook for the USD/INR:
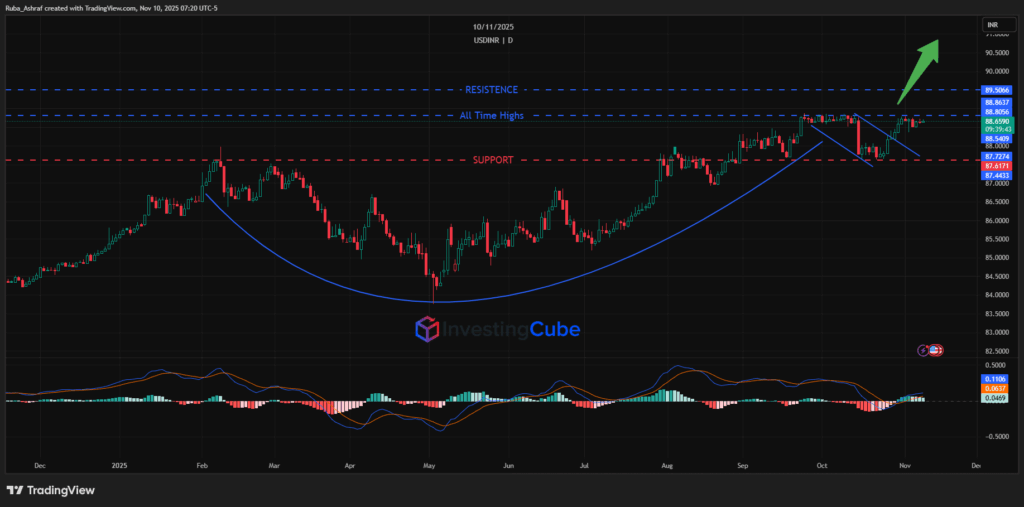
The outlook remains as we discussed last week. The USD/INR is struggling to break above the 88.80 resistance level but continues to consolidate above 88.00, showing strong underlying support. The pair remains capped by its all-time highs, which continue to act as a key ceiling for further gains.

A clear breakout above this resistance zone (around 88.50-89.50) would open the door for new record highs, potentially targeting the 90.00 level. On the downside, immediate support lies near 87.60-87.40, where buying interest has consistently emerged.
The cup-and-handle pattern formation and improving MACD momentum indicate a bullish bias, but sustained movement above the all-time highs is essential to confirm further upside momentum.
The Nifty 50 Outlook:
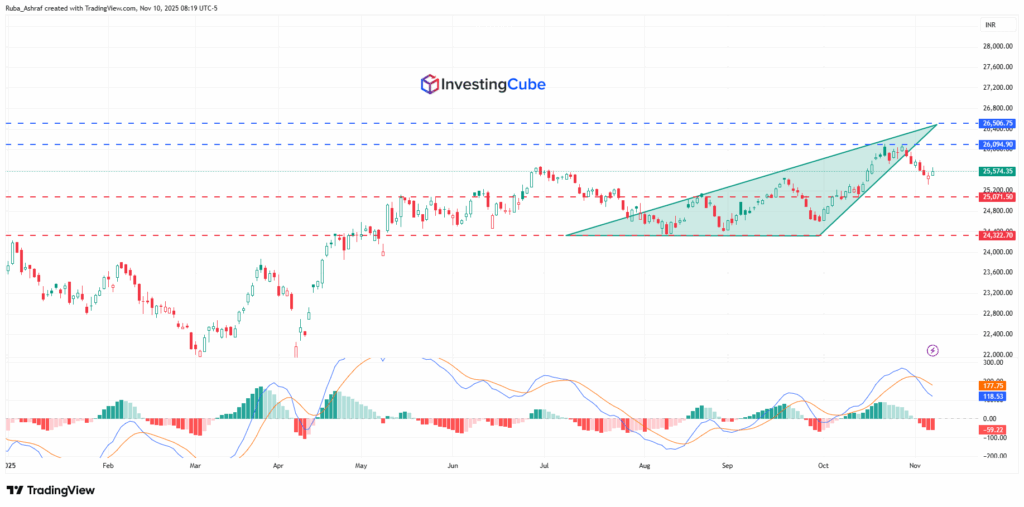
The outlook for the Nifty 50 shows a cautious tone after a recent pullback from the upper boundary of an ascending pattern. The index failed to sustain gains above 26,000, a key resistance area marked by multiple failed attempts, and has since retreated toward the 25,500 region.
The rising wedge pattern formation suggests lagging bullish momentum, because each rally has met with selling pressure near higher levels. The support area lies around 25070, followed by a stronger base near 24320. A clear break below this zone could trigger a deeper correction, while holding above it keeps the medium-term uptrend intact.
On the upside, a decisive move above 26,100-26500 would invalidate the wedge’s bearish signal and suggest renewed strength toward new highs. The MACD indicator shows a bearish crossover, hinting at short-term weakness or consolidation before any fresh directional move.
A stronger USD/INR means a weaker rupee and often pressures equities by raising import costs and inflation risks. A stronger rupee boosts foreign inflows and market sentiment, typically boosting Nifty performance in the medium term.
USD/INR faces resistance near 88.80-89.50 and support around 87.40. For Nifty 50, resistance lies at 26,100–26,500 with support near 25,070–24,320, both crucial zones for short-term trend confirmation.