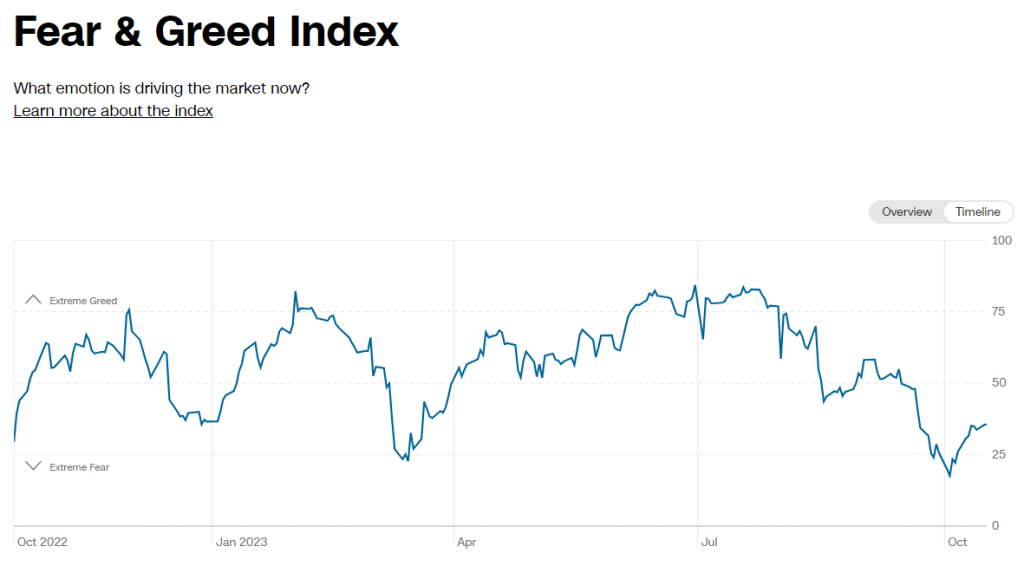
The Fear and Greed index seems to have improved since I last covered it in September. The index, which consists of 7 different indicators now stands at 35. This is a signal of fear in the US stock market. At the start of October, the index plunged to 20, which was its lowest level in 2023.
During the last FOMC meeting, the Fed made some hawkish remarks that pointed towards a possible rate hike at the end of 2023. The markets did not take the FOMC statement well, as the Nasdaq 100 index lost 736 points and plunged to its 3 month lows. The S&P 500 index also followed by dropping 5.3% toward its June lows.
The Fed Chair’s speech may increase the volatility in today’s trading session.
Interest Rates To Remain Unchanged In The Next FOMC
Investors remain at a standstill as the highly anticipated FOMC meeting is right around the corner. The recent indications from the Federal Reserve suggest that the rates will remain high throughout 2023. According to the CME FedWatch tool, there is an 88.8% probability for the rates to remain the same in the next FOMC meeting which is scheduled on 1st November.
The Fear and Greed index comprises 7 different indicators that collectively help investors judge the sentiment in the market. The index gives a score from 0-100. A score of 0-49 indicates fear, while a score of 50-100 indicates greed in the market.
Markets Still Driven By Fear Ahead Of Chairman Speech
At press time, four out of the seven indicators show the presence of fear in the market. The Stock Price Strength is sitting at its new yearly low. Side by side, The Stock Price Breadth also shows the price breadth around its March lows. This is an indicator of intense fear among equity investors.
However, the Market Momentum and the Market Volatility are still signaling neutrality in the market. The demand for Safe Haven Assets seems to be falling as the indicator shows a 0.35% difference in the 20-day stock and bond returns. This means that investors are currently preferring stocks over bonds due to the recent pullback in bond yields.