

- The Facebook share price has posted a 4th day of strong gains amid higher investor demand, despite lawsuits from Amazon and others.
The Facebook share price is solidly higher this Wednesday and looks set to post the 4th day of gains after investors shrugged off news of Amazon’s lawsuit against Meta Platforms Inc over fake reviews. The Facebook share price is up 3.34% as it opened with an upside gap amid strong demand for the stock.
Technology stocks on the Nasdaq 100 are having a generally good week after closing higher on Tuesday. The Facebook share price had added 5.11% on Tuesday after the company said it would cooperate with Amazon to remove the accounts creating fake product reviews on Amazon stores. How long investors will maintain their appetite for the stock remains to be seen, as the company faces several lawsuits, including a trademark lawsuit by a virtual reality company over the use of the name “Meta.”
The Facebook share price will come under scrutiny on 27 July when the company releases its second-quarter earnings for 2022. Analysts are predicting $2.58 per share in earnings, with expected revenue of $29.02 billion. This is a tad higher than its previous quarter’s earnings of $2.52 and revenue of $27.91 billion.

Facebook Share Price Forecast
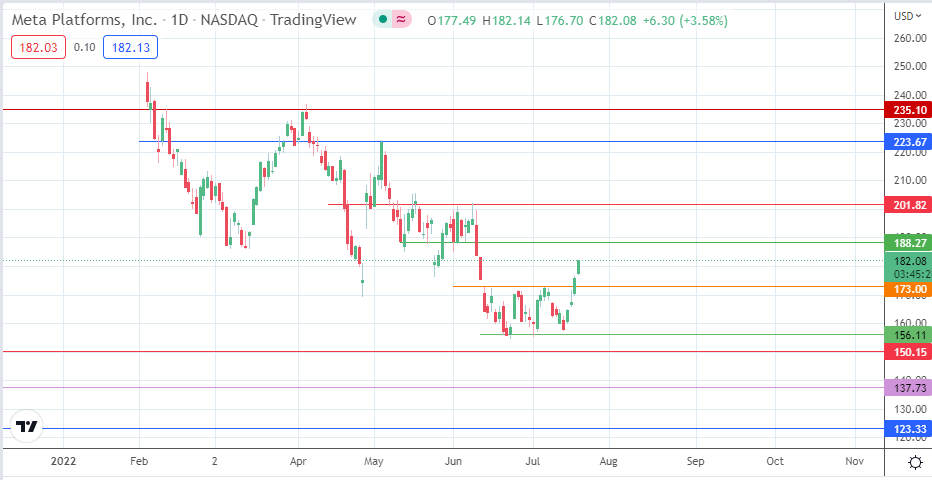
The triple bottom pattern on the daily chart has been confirmed with the breakout from the neckline located at the 173.00 psychological price area (8 July high). This gives the bulls clear skies to aim for the measured move’s completion point at the 188.27 resistance level, the site of the 1 June/6 June 2022 lows. The 201.82 (8 June high) and 223.67 resistance levels (4 May 2022 high) are additional targets that come into the picture on a further advance.
On the flip side, only a rejection at the site of the measured move’s completion point will allow the bears to retest the neckline in reverse mode, with a breakdown bringing 156.11 (23 June low) into the picture as a potential downside target. Other targets to the south are seen at 150.15 (26 March 2018 low), 137.73 (18 March 2020 low) and the 21 December 2018 low site at 123.33.
META: Daily Chart