Trading with the benefit of hindsight is always a winner, but unfortunately not possible. However, we can sometimes use historical patterns to try to predict what may happen in the future.
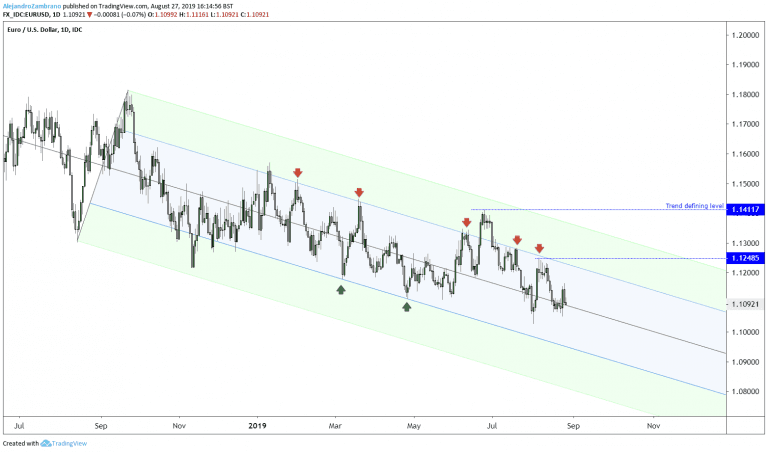
The EURUSD pair has been drifting lower since February 2018 when the price reached a high of 1.2553, however, from June 2018 the trend turned sluggish and EURUSD price volatility dropped to 1985 lows. The sluggish decline is well explained by drawing a Andrew’s Pitchfork using the August 2018 low of 1.13 and the September 2018 high as reaction points.
As seen in the chart below the pitchfork has done an excellent job explaining the majority of the price action in 2019. In the chart below we have highlighted four good sell-signals and two good buy signals. Going forward, the pitchfork suggests that around the 1.1200 – 1.1248 interval traders will be interested in short-selling targeting the median-line around the 1.1090 level followed by the lower parallel line at 1.0950. In case of an aggressive correction that extends above the 1.1248 level the price might reach the upper downward trendline currently at 1.1365, and that might be the next sell-zone. For the multi-month trend to turn bullish the price would need to trade above June high of 1.11411. Some traders will be interested to buy at the lower levels of the pitchfork, but traditionally is better to trade with the trend instead of against it.
Don’t miss a beat! Follow us on Telegram and Twitter.
One reason for the sluggish downtrend is that the Federal Reserve is reducing their interest rate to stimulate an economy that is suffering from a slowdown, and the turmoil of trade wars. When writing this update in the last week of August, China had just introduced new tariffs on US imports, while President Trump has quickly retaliated by planning to increase tariffs on September 1 and December 15. The ECB is also getting ready to cut interest rate, and some economists suggest that the ECB deposit rate might decline to negative 60 basis points. The German 10-year government bond yield was already at a negative 69 basis points on August 27. The same rates in the US were 2.25% and 1.48% respectively. Negative yields mean that banks need to pay the ECB to leave their money with the central bank, and in the case of the German government bond yield the investors will receive less than what they invested. The sharp contrast in interest rates might explain why the EURUSD has drifted lower and not higher, even if the Federal Reserve in 2019 was cutting interest rates. There is also a divergence in economic growth, the US economy has had a decent economic growth compared with the Euro Area. In the US annual GDP increased by 2.3%, while in the Euro area it increased by 1.1%. However, the Euro area’s largest economy, Germany, had barely grown since 2018 and in some quarters, the economy contracted. To further differentiate the two economies the ECB had hinted that it was ready to introduce quantitative easing, something that the Fed has ruled out, also on October 31 Christine Lagarde will take over after Mario Draghi, and I suspect that it will lead to a much more dovish ECB. October 31 will also be the day the UK is set to leave the EU, which again could prove to be another reason to assume that EURUSD will drift lower. As it stands right now, the US economy would need to slow much faster, and the FED would need to cut rates much faster than the ECB to reduce the interest differential benefit of the United States of America.Download our latest quarterly market outlook for our longer-term trade ideas.
Do you enjoy reading our updates? Become a member today and access all restricted content. It is free to join.