

- The EUR/USD has tailwinds behind it fundamentally, but faces a key test of resistance at 1.05771 before it can advance.
The EUR/USD barely hangs on to earlier session gains this Monday, as the price action has met resistance at the 1.05771 price mark. This follows Friday’s 0.33% uptick that has enabled the price action on the daily chart from a bullish harami candlestick pattern. Completion of the upside move from this pattern is not assured, as a bullish outside day candle has to form to remove the limiting barrier for a bullish continuation of the recovery move that started from a bounce on the 1.03534 support level.
The fundamentals that could impact the pair this week kick-off in Portugal, where the ECB Forum will hold on Tuesday. This forum kicks off after the conclusion of the G-7 meeting, where the talking point will be what to do with Russia’s oil. This meeting will see three central bank chiefs in attendance: Fed’s Jerome Powell, the ECB’s Christine Lagarde, and the BoE’s Andrew Bailey.
The expectations of the market are for risk sentiment to continue from Friday. Russia’s oil is expected to keep flowing, albeit with some limitations. China’s lifting of the Shanghai lockdowns and the knock-on effect will also boost risk sentiment. However, Tuesday’s Consumer Confidence report out of the United States will test the resolve of traders’ appetite for risk.
Later this week, the Fed’s inflation barometer, the Core PCE Price Index (m/m) will be released. There will be no Non-Farm Payrolls report this Friday as the US prepares for its Independence Day weekend.
EUR/USD Outlook
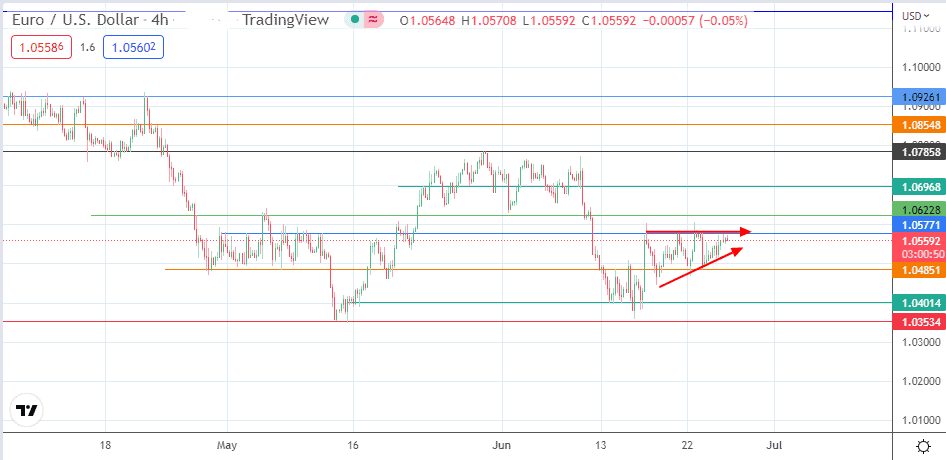
The pair is approaching the 1.05771 resistance level, which has been the resistance for three trading days. A break of this barrier is required before the bulls can access the next target, formed by the 4 May high and 9 June low at 1.06228. This move also completes the ascending triangle’s breakout. Above this level, there are additional targets at the 1.06968 resistance level (23 May and 7 June highs), which is where the

triangle’s measured move is expected to expire. However, an additional bullish push will make the 1.07858 price mark available to the bulls. This price resistance houses a previous low on 20 April and a prior high on 30 May 2022.
On the flip side, the failure of the bulls to break the resistance at 1.05771 could lead to a rejection that targets 1.04851 if the pullback move degrades the triangle’s lower border. Below this support, a further move south targets 1.04014 (14 June low). Further price deterioration makes 1.03534 available. This is where a previous low came up on 13 May 2022.
EUR/USD: 4-hour Chart