- Our short-term Ethereum price prediction might flip bullish if the ongoing breakout succeeds. Expect new lows in case of a closure below $998.
Our short-term Ethereum price prediction might flip bullish if the ongoing breakout succeeds. On Monday morning, Bitcoin price is trading at $19,138 while Ethereum USD price is on the verge of a breakout of the symmetrical wedge. However, overall, the ETH price is still in a downtrend on a higher timeframe as the coin failed to make a higher high, last week.
At the time of writing, Ethereum price is trading at $1055, and it has been 1.9% down since yesterday. The cryptocurrency has been in a severe downtrend since the start of the year and is 78.5% down from its ATH. This negative price action coincides with the corresponding downtrend in the Bitcoin price action during the same period. The ongoing crypto slump has sent most altcoins into a downward spiral without any sign of reversal in sight.
Nevertheless, most indicators are already overextended, suggesting that the market is close to at least a short-term bottom. While many analysts are calling for a dip to $500, bulls are already accumulating in anticipation of the much-awaited Ethereum 2.0. According to official Ethereum news, the Ethereum merge may occur anytime between August and November.
Ethereum Price Prediction
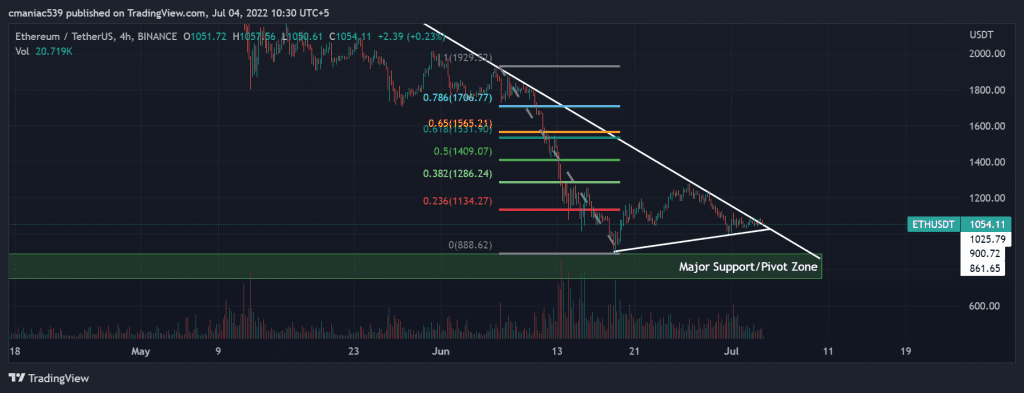
Technical analysis of the ETH price chart shows that the price has recently faced rejection from $1,280. This price level acted as a pivot as it was in alignment with the 0.382 Fib retracement level. This level was formed by connecting the high and low of June 2022. Nevertheless, the price is still more than 18%, up from the June low of $880.
If ETH closes a 4H candle above the downward trendline, then the price can retest the $1180 level very soon. In the event of a bullish Bitcoin price action, $1500 also seems to be a valid Ethereum price prediction. However, this analysis would be invalidated in case of a daily closure below $998. Fresh lows are also quite likely in such a scenario if Bitcoin make new lows.

ETH USD 4H Price Chart
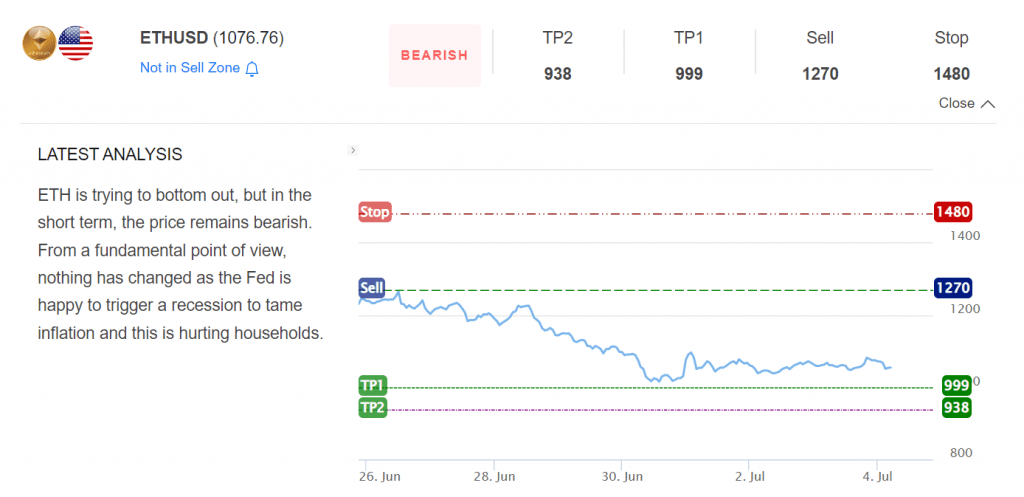
InvestingCube’s Premium S&R Levels
If you’re trading in these unprecedented market conditions, then it is highly recommended to subscribe to InvestingCube’s Premium S&R Levels indicator. This indicator keeps you updated when the price enters a trading range and suggests the likely targets.
As per the Ethereum price analysis of the indicator, the short-term outlook is bearish. This is due to the fact that the price has not broken out of the downtrend yet.