

- Is a breakout of the Dunelm share price imminent? This article discusses the possibilities that currently exist on the stock.
The Dunelm share price added 0.15% on Tuesday as the stock prepares for what could be a period of boom for the company. Dunelm is coming into 2022 on the back of robust Christmas sales, as the British public spend to give their homes much-needed facelifts after a difficult period under the pandemic. In January, brokerage firm Peel Hunt had upgraded the company’s full-year profit forecast to £206.1million, an increase of £27 million over the previous outlook.
The situation favours a potential breakout from the trading range that has lasted for several months. Dunelm Group PLC had declared its interim results for the 26 weeks which ended 25 December 2021, declaring a record half-year profit before tax of £140.8m, representing a 25.3% year-on-year increase over the same period the previous year.
The record half-year profits resulted from a robust increase in sales. Sales grew 10.6% compared with the same period under review in 2021 and 36.0% against the 2020 figures. Aggressive cost-cutting measures also helped the company in this regard. The company also declared an interim dividend of 14p, a 2p increase over the dividend paid in the same period the previous year.
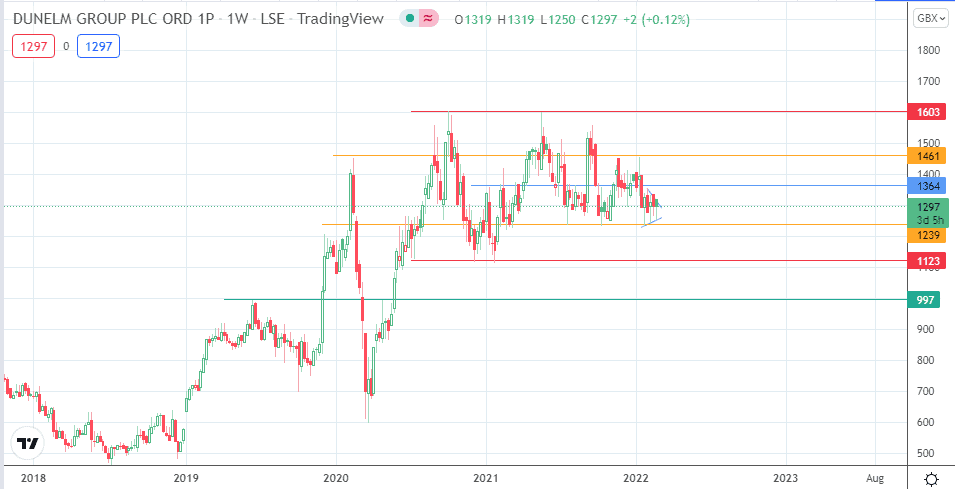
Dunelm Weekly Chart Outlook
The Dunelm share price has been trading in a range for the more significant part of the last fourteen months. The 1600 resistance barrier serves as the ceiling, and 1123 serves as the floor. In between these boundaries, various levels of support and resistance exist.
The price is currently trading in an emerging symmetrical triangle. The active weekly candle’s bounce off the triangle’s lower border has put it on course for a test of the upper edge of the triangle. A break here takes the Dunelm share price candle towards the 1364 resistance (11 January 2021 and 8 November 2021 highs). If the bulls take out this resistance, 1461 becomes a new target to the upside before 1603 becomes available as a new target. A break of 1603 will eventually lead to new highs for the stock.
On the flip side, rejection at the triangle’s upper border, followed by a pullback, sends the price back towards the lower boundary and the 1239 support. If this support collapses, 1123 becomes the next downside target. Only when 1123 (former double bottom at 7 December 2020 and 25 January 2021 lows) gives way does 997 become a viable downside target. This move would break the range to the downside, increasing the chance of a further correction.
Dunelm: Weekly Chart
Follow Eno on Twitter.