


- The Dow Jones forecast is for the NFP, the upcoming Fed decision and the geopolitical situation in Ukraine to determine price action.
Three critical factors would determine the Dow Jones forecast for the month. The first is the outcome of the Non-Farm Payrolls report, scheduled for release on 4 March. Secondly, the ongoing war between Russia and Ukraine provides a geopolitical angle to market sentiment. The third is the Fed’s interest rate decision and the accompanying speech by Fed Chair Jerome Powell. This highly anticipated news event comes up on 16 March.
Dow Jones latest news
First, let us take the NFP report. This Friday, the gradual improvement in US labour conditions will be put to yet another test. Analysts predict a slight drop from 467K in January to 407K in February, a reduction in the unemployment rate from 4.0% to 3.9%, while wage inflation is projected to ease from 0.7% to 0.5%. It may take a red-hot shock on either side to significantly move the US markets and alter any Dow Jones forecasts. So overall, some cooling in the numbers is expected.
The US market has been responding more to geopolitical factors, with the situation in Ukraine continuing to remain fluid. The US markets fell steeply last week when the Russians invaded Ukraine. But the drop has leveled off somewhat. It would take a striking escalation on both sides to draw a steep market reaction.
Improvement in the job numbers and the rise in consumer inflation to 40-year highs have forced the Fed’s hands with a 50% rate hike on the cards. This could have a profound impact on the Dow Jones forecast in March.
Dow Jones Forecast
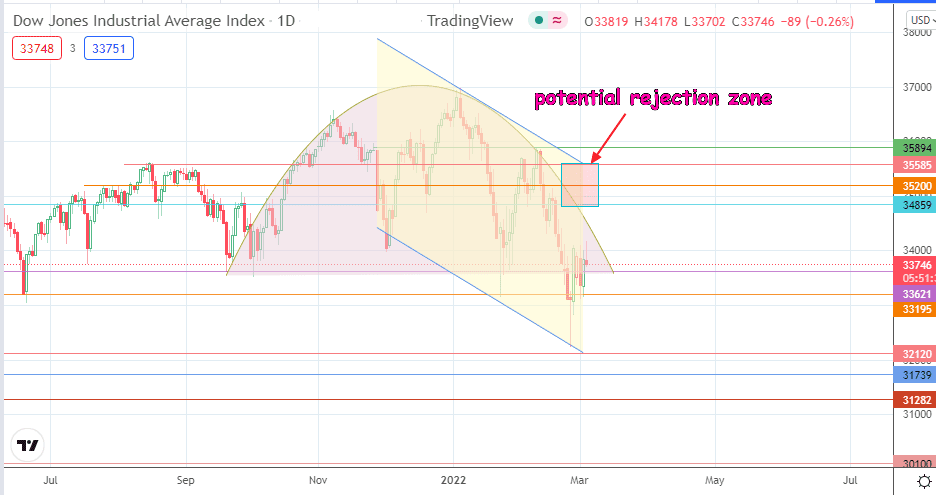
There are two interesting patterns on the daily chart. There is an evolving rounded top and a descending channel. The price activity has just bounced off the 33195 support level (18 June 2021 low) and is approaching the arc of the rounded top. This puts the price action in direct conflict with the 34860 price resistance and the 35200 price mark. Being the price levels where the two patterns could top out, traders should look out for the boxed area between these resistance landmarks.

This could be the site of a rejection of price. In this case, the bears would seek a drop towards 33621 (neckline) before 33195 and 32120 come into the picture as other destinations. Conversely, a break of the shaded box allows for a test of 35894 and ultimately the 37,000 all-time high.
Dow Jones: Daily Chart
Follow Eno on Twitter.