The Dow Jones index has erased most of the gains it made last week amid rising concerns about the American economy. It crashed to a low of $29,239, which was the lowest level on October 4th of this year. It has plunged by more than 20% this year and is hovering at the lowest level since November 2020.
Fear and greed plummet
The Dow Jones has been in a strong bearish trend in the past few days as investors remain fearful about the market. A closer look at the fear and greed index shows that it has collapsed to 18, the lowest level in months. Most of its indices are in the extreme fear level, including the market momentum, stock price strength and breadth, put and call options, and the VIX index.
In most cases the Dow Jones usually slips when the fear and greed index moves to extreme fear zone. Investors are worried about the state of the economy, the strong US dollar, and corporate earnings. The next key catalyst for the Dow Jones and Nasdaq 100 will be the upcoming American inflation data and quarterly earnings.
Economists believe that the country’s inflation remained at an elevated level in September even as gasoline prices ease. These numbers will be published on Thursday. At the same time, giant banks like JP Morgan, Wells Fargo, and Citigroup will publish their quarterly results this week. These Globally Systemic Institutions hold about 67% of all banks in the category. Historically, they usually set the tone for the broader market.
Most Dow Jones constituents are in the red this year. The worst performers are companies like Intel, Nike, Salesforce, Disney, and 3M. All these shares have lost more than 40% of their value. The only four Dow Jones stock in the green are Chevron, Merck, Amgen, and Travelers.
Dow Jones index forecast
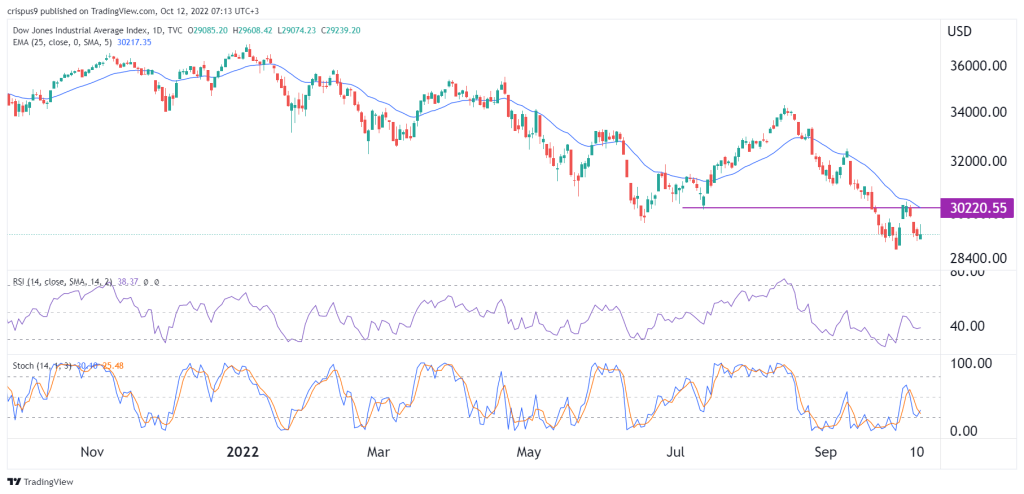
The daily chart shows that the Dow Jones index has been in a strong bearish trend in the past few months. In this period, it has managed to crash below all moving averages. It also did a break and retest pattern when it rose to a high of $30,220 last week. This was a notable level since it was the lowest level on Friday 15.
The Dow has moved below all moving averages while the Stochastic Oscillator has moved close to the oversold level. At the same time, the Relative Strength Index (RSI) has tilted lower. Therefore, the index will likely continue falling as sellers target the key support at $28,400. The stop-loss for this trade will be at $30,200.