
- The spread between fixed income volatility versus equity volatility is widening further and further. This means that the highly interest rate-linked bond market continues to show strong turbulence.
It remains unclear what the Fed’s next move will be. Year-on-year growth data for the U.S. economy could serve as a clue.
This article shows some evidence that monetary policy turmoil is reaching market highs.
The spread between fixed income volatility versus equity volatility is widening further and further. This means that the highly interest rate-linked bond market continues to show strong turbulence.
US short-term bond yields far exceed long-term bond yields. Investment flows do not trust the short term because they are not able to have a clear view on what the Fed’s decision will be. It is not even clear if the promised soft-landing will happen, or, on the contrary, an economic recession will hit the markets unexpectedly.
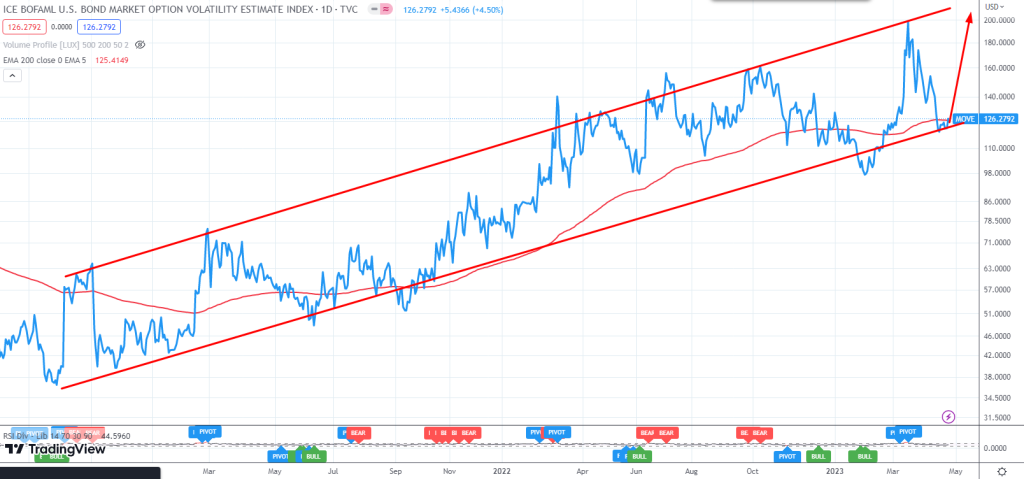
The MOVE index, which measures the volatility of U.S. Treasury bonds, has been rising steadily over the past few weeks.
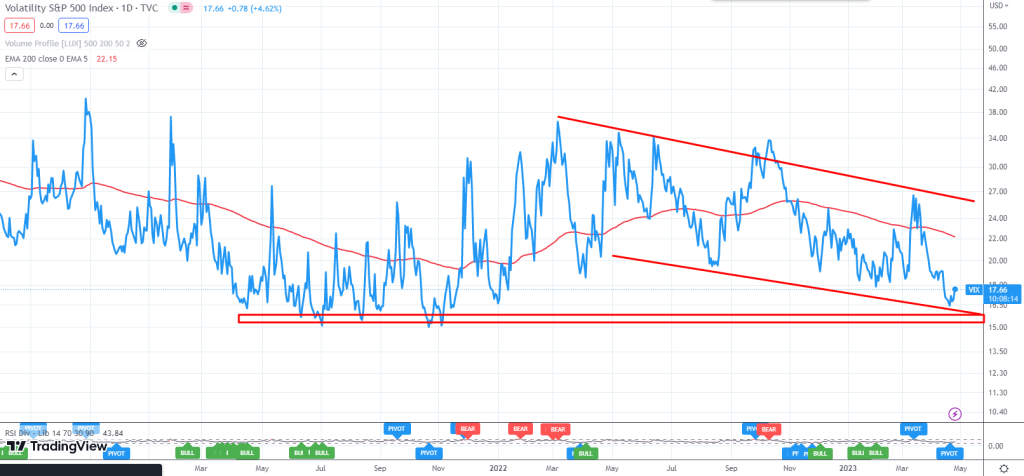
However, the VIX index, which measures the volatility of Wall Street equities, is in the low zones. Generally, a VIX at lows is a prelude to market events that trigger volatility, the calm before the storm, one might say.
Fixed Income vs. Equity volatility divergence.

This widening of the spread between the MOVE and the VIX is clear proof of the moment of indeterminacy we are in.
In this context, and taking into account that the US yield curve has been trending negative for a long time, a possible strategy would be to be bearish on the US equity market. Expecting low equity volatility to rebound in line with fixed income volatility.
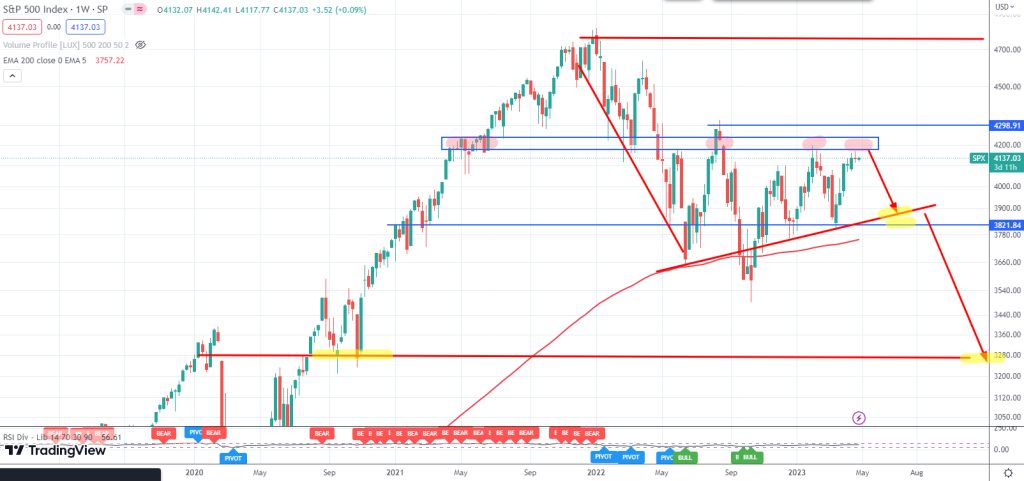
The SP500 is at its third resistance ceiling. Since August 2022, it has consistently failed to break above 4200 points. The last three times, when prices have approached these levels, there have been sharp corrections to 3800 and even 3600.
Please remember that the purpose of this article is not to advise or influence any reader’s operating judgment. Financial markets involve high risk, consult your financial advisor before investing.