

- Bitcoin, Ethereum and XRP consolidate mid-week as traders watch key support zones ahead of a possible breakout in the crypto market.
The top three cryptocurrencies, Bitcoin, Ethereum and XRP, are trading sideways mid-week as risk appetite cools across digital assets. BTC is consolidating above $103 K after a failed breakout, ETH slips below $3,500 as buyers test a key support cluster, and XRP holds ground near $2.35 after last week’s strong rebound. The market appears to be entering a short consolidation phase before the next decisive move.
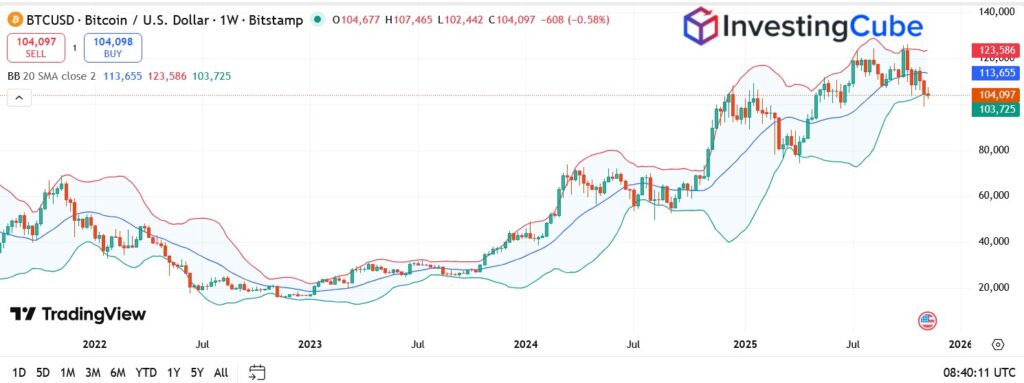
Bitcoin Price Today: BTC Holds Above $103 K After Mid-Week Profit-Taking
Bitcoin’s attempt to climb past $106,400 earlier in the week faltered as selling pressure returned near the 38.2 percent Fibonacci retracement. The failure at that level triggered short-term profit-taking, sending prices back toward the $103 K zone, which has so far acted as a reliable floor. On the weekly chart, BTC continues to trade around the middle Bollinger Band, suggesting the market is pausing rather than reversing.
Investor sentiment is steady but cautious. Traders are waiting for fresh macro cues, especially this week’s U.S. inflation data, to gauge whether appetite for risk assets will return. The broader setup points to a consolidation phase that may precede the next directional move.
Bitcoin Technical Analysis
Volatility has tightened as shown by the narrowing Bollinger Bands. RSI (14) is near 41, indicating a slowdown in buying momentum, while MACD lines remain close to convergence, typical of markets waiting for a breakout.
If BTC maintains support at $103 K and closes above $106,450, it could extend its recovery toward the 50-day EMA around $109,700. A breakdown below $100,350 would expose the next support near $97,800.
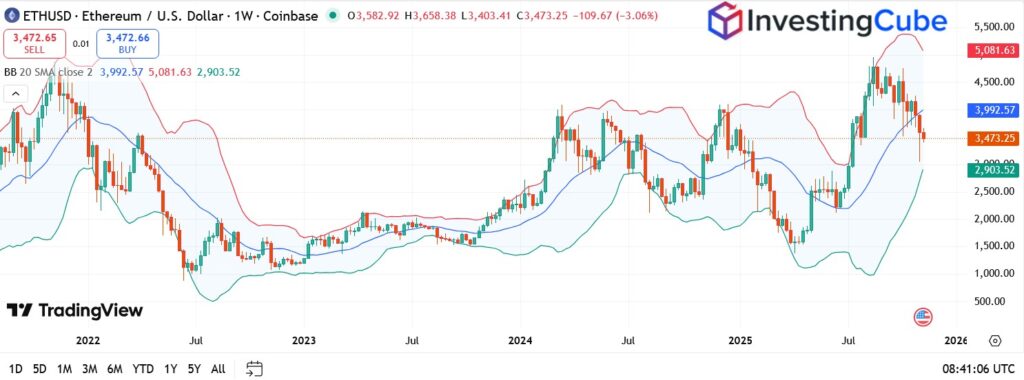
Ethereum Price Today: ETH Retests $3,400 as Momentum Softens
Ethereum mirrored Bitcoin’s pullback after buyers failed to sustain gains above the $3,592 resistance area on Monday. The token briefly rebounded from $3,171 earlier in the week but has since slipped back to trade near $3,400. On the weekly timeframe, ETH is hovering close to the mid-Bollinger Band, a level that often acts as balance between buyers and sellers.
Despite the retracement, market tone remains calm. Traders appear to be rotating out of leveraged long positions while waiting for confirmation that $3,300 will hold as a base. The absence of strong inflows suggests investors are protecting capital until volatility picks up again.

Ethereum Technical Analysis
The RSI (14) stands around 45, signalling weak momentum but no breakdown. MACD histogram is flattening at the zero line, a reflection of short-term indecision.
Immediate support lies at $3,300 and $3,171, the 50 percent retracement of the previous rally. Resistance levels remain at $3,592 and $3,868 (50-day EMA). A close above $3,600 would confirm bullish recovery, while a move below $3,300 could open room for another dip toward $3,050.
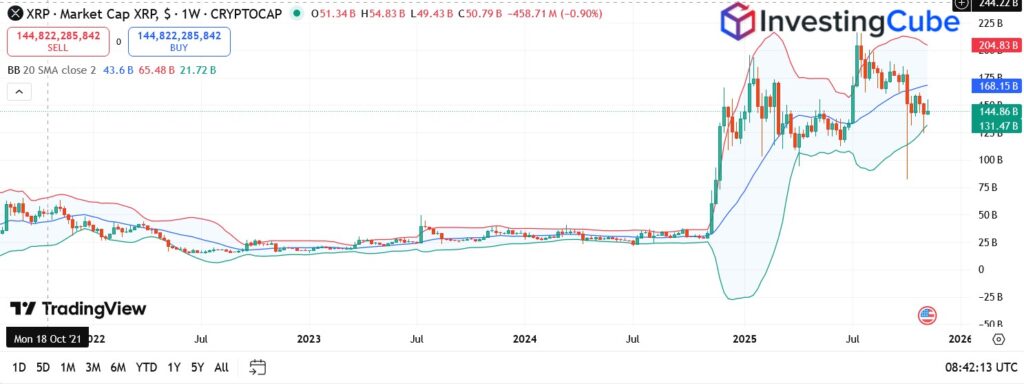
XRP Price Today: XRP Holds $2.35 Support Amid Broader Market Pause
XRP is consolidating around $2.39 after failing to clear the $2.55 ceiling earlier in the week. Despite mild losses, the weekly structure remains constructive: prices are anchored above the middle Bollinger Band near $2.35, showing buyers are still defending this region.
The token’s market cap hovers around $144 B on TradingView data, with a balanced buy-sell ratio indicating calm conditions after October’s volatility spike.
XRP Technical Analysis
RSI (14) reads 47, neutral, yet improving compared to last week. The MACD signal stays in positive territory, suggesting underlying accumulation.
If XRP holds above $2.35, it may retest $2.55 and $2.70 in the coming sessions. A breakdown below $2.35 would expose $1.96 support.
Crypto Market Outlook: Quiet Mid-Week, Steady Bias
The top 3 cryptos are tracking similar technical paths, sideways ranges, compressed volatility, and neutral momentum. While the short-term picture looks muted, the broader uptrend from late 2024 remains intact.
From a trader’s standpoint, this feels like the calm before the next rotation. Support levels are holding, volume is steady, and volatility bands are tightening, often precursors to a directional breakout. Unless macro shocks emerge, the market’s current consolidation may serve as a base for a late-November recovery.
