

Ethereum (ETH) has been caught in a brutal selloff, plunging from $2,815 to as low as $2,315 after a massive $1.5 billion hack on Bybit. On Monday, ETH crashed alongside Bitcoin as panic spread across the market. Yesterday, the price attempted a weak recovery but failed to reclaim key resistance levels, leading to another sharp decline today. With ETH now struggling near $2,440, traders are asking: Is this the bottom, or will Ethereum sink even lower?
Ethereum Chart Analysis – Key Levels to Watch
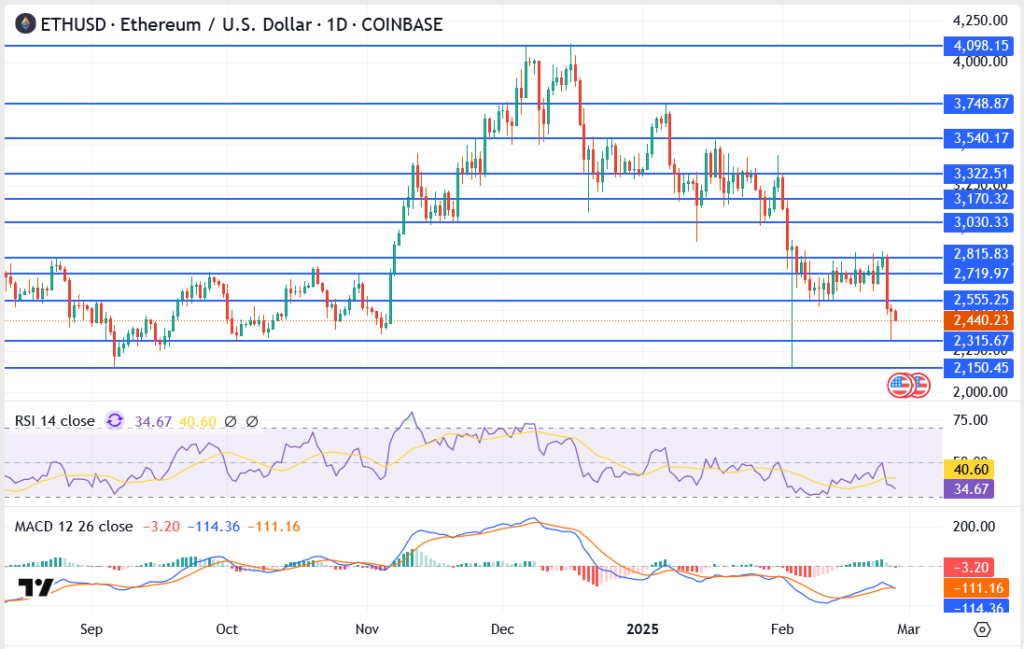
- Resistance Levels:
- 2,555 – Immediate resistance; ETH must reclaim this for any meaningful recovery.
- 2,719 – 2,815 – Major supply zone where sellers could return.
- 3,030 – 3,170 – Bullish confirmation zone; a breakout here could shift sentiment.
- Support Levels:
- 2,440 – ETH is testing this level; a breakdown could lead to further losses.
- 2,315 – Critical support; a breach could see ETH fall below $2,200.
- 2,150 – Worst-case scenario if selling pressure intensifies.

What’s Behind Ethereum’s Selloff?
Ethereum’s crash was driven by the $1.5 billion Bybit hack with Bitcoin’s drop below $90K worsening the selloff, dragging altcoins lower. Liquidity concerns and regulatory fears added pressure, while leveraged liquidations accelerated the decline, forcing more traders to exit.
Ethereum Price Forecast a Rebound Ahead?
With panic still gripping the market, traders should brace for high volatility. A strong bounce in Bitcoin could help ETH recover, but if BTC continues sliding, Ethereum will struggle to find a floor.
For now, Ethereum remains in survival mode—but as history has shown, deep selloffs often create the best buying opportunities.
