




Archived Article This article was published more than 5 months ago. The market data, prices, forecasts, and analysis were accurate at the time of publication but may have changed since then. Please use this article for historical reference only and refer to our latest content for current market information.
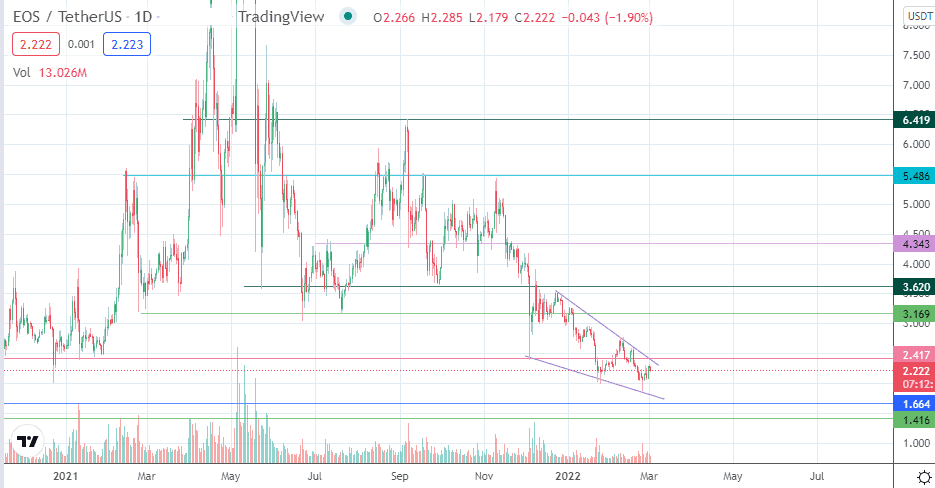
- The EOS price prediction could end up on the bullish side if the falling wedge pattern resolves with a bullish break towards $3.60
The short-term EOS price prediction could be dictated by the price pattern on the chart and not necessarily by any fundamentals of the token itself. The drop in the EOS/USDT pair was brought about by the comments of the EOS Foundation’s CEO some months ago, in which he gave a negative appraisal of the company’s performance in the last two years. Following his remarks, EOS has endured a relentless selloff, which was worsened by the negative performance of the crypto market since Omicron emerged in mid-November 2021.
EOS latest news
Since then, the EOS Network Foundation has released its EOS Core+ Blue Paper, in which it details the road map for the project going forward. Block One has been voted out of the EOS governance mechanism. It has set up a launchpad mechanism to prepare the project for initiatives it has set out in the Lift-Off stage.

EOS could potentially challenge Solana in the future if it can put its house in order, given that Solana has deep technical issues and has suffered one-too-many attacks on its network in recent times. The EOS/USDT pair is down 1.90% as of writing, as it faces rejection at the upper border of the emerging wedge pattern on the daily chart.
EOS Price Prediction
The emerging wedge pattern is expected to end with a bullish breakout above the 2.417 resistance level (which intersects the wedge’s upper border). However, the pattern remains in evolution, and Wednesday’s rejection means that a downside move towards 1.664 looks inevitable.
A bounce from this support level (which intersects the wedge’s lower border) allows the bulls to push for a breakout. If successful, 3.169 becomes an immediate destination to the north. 3.620 and 4.343 could become additional targets if the advance pursues completion of the pattern’s measured move. On the flip side, a breakdown of 1,664 invalidates the pattern and sets up the price action to hit new all-time lows. 1.416 (14 March 2020 low) could be a pitstop in this process.
EOS/USDT: Daily Chart
Follow Eno on Twitter.