

- The recent Cosmos price rally is facing its toughest test yet. In the last 6 months, ATOM has failed to clear $30.00, will this time be different?
The recent Cosmos price rally is facing its toughest test yet. In the last 6 months, ATOM has failed to clear $30.00. Will this time be different? Whilst the surging cryptocurrency market has lifted many assets to new record highs, ATOM coin has been somewhat of an under-performer. Considering Cosmos (ATOM/USD) has increased by more than 50% over the last month, this is saying something. However, despite this, ATOM has so far failed to break out on the upside and remains around 47% below its February $47.09 high. Furthermore, it has now reached the level that reversed previous rallies.
ATOM PrIce Forecast
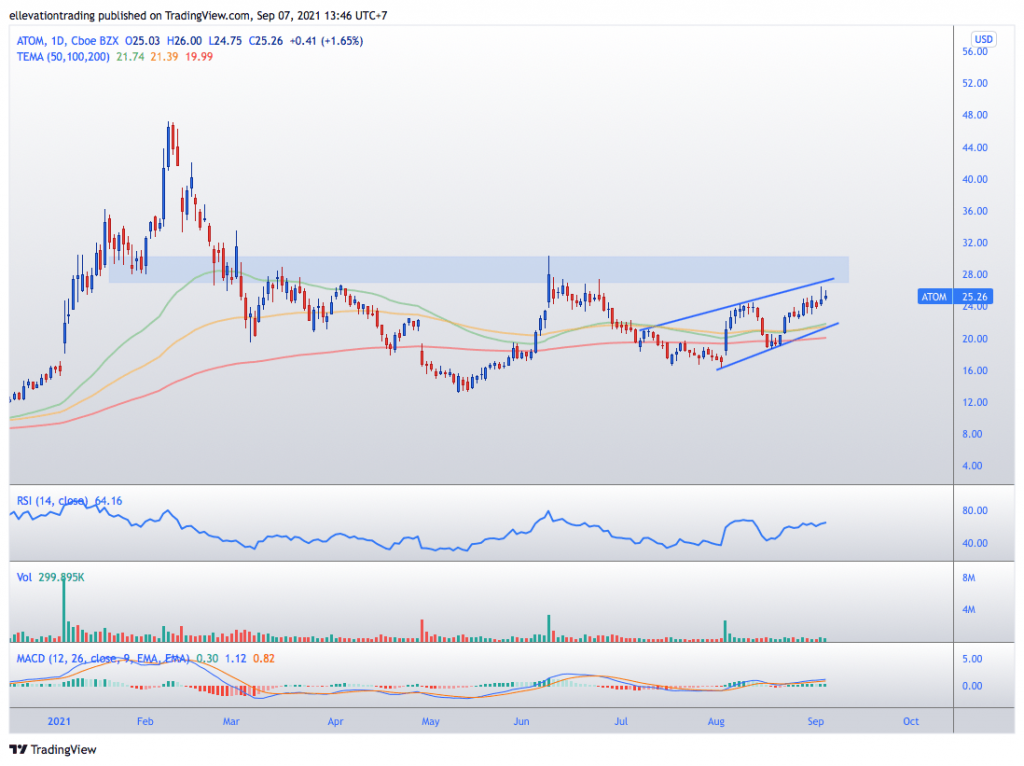
The daily chart shows the Cosmos price reach its all-time high in February. However, as the broader market advanced through April and May, ATOM was already in the grips of a bear market. This reached a nadir in May, around a week before the wider crypto collapse when ATOM traded down to $13.23.
Since then, Cosmos has traded broadly sideways, although the recent uptick has seen buyers return. However, the price increase has lifted Cosmos towards robust overhanging resistance.

A clear band of resistance is visible between $27.00 and the June high of $30.27. This has been the scene of three failed breakout attempts since March. Therefore, until ATOM convincingly clears $30.27, it remains vulnerable. Additionally, trend resistance is seen at $27.40, which adds to the considerable obstacles on the upside.
In saying that, if the Cosmos price does manage to break above $30.27, the outlook turns incredibly bullish. In that event, the path to the February high is clear. Although until that happens, a wait and see approach may be prudent.
The price is supported by the 50,100 and 200-day moving averages ($21.74, $21.39, $19.99, respectively). Additionally, a trend line at $21.50 adds to the price support below the market. As long as ATOM remains above the 200-day, its chances of clearing $30.27 remain intact. However, a drop below the 200 DMA would suggest another failed rally and lead to lower prices.
Cosmos Price Chart (Daily)
For more market insights, follow Elliott on Twitter.
