
- Copper Price Forecast - XCU/USD is gaining strength and may retest $3.90 in the coming days
Copper price (XCU/USD) is gaining momentum after a major pullback in August. The metal is up 4.8% from the monthly lows. Technical analysis suggests that volatility is about to increase as the price moves close to the apex of a trading pattern.
After a 0.95% gain on Tuesday, copper futures opened higher on Wednesday. Till press time, the candle had turned red but was still 0.79% above its previous close. On a weekly timeframe, this translated into a gain of 1.61% as the precious metal seemed on track for the 2nd consecutive green week.
XCU/USD Gains Strength As DXY Index Tumbles
On Wednesday, the dollar strength index showed weakness as the latest job data showed that the job market is weakening. This also acted as a headwind for the commodity prices, and Copper opened higher today. However, the bulls couldn’t gain momentum, and the Copper price stood at $3.827 at press time.
Copper is currently facing headwinds from the deteriorating Chinese economy. However, investor confidence is expected to improve after the Chinese central bank has announced to relax the residential housing loan rules. The move will support the country’s weakening housing market.

Copper Price Forecast
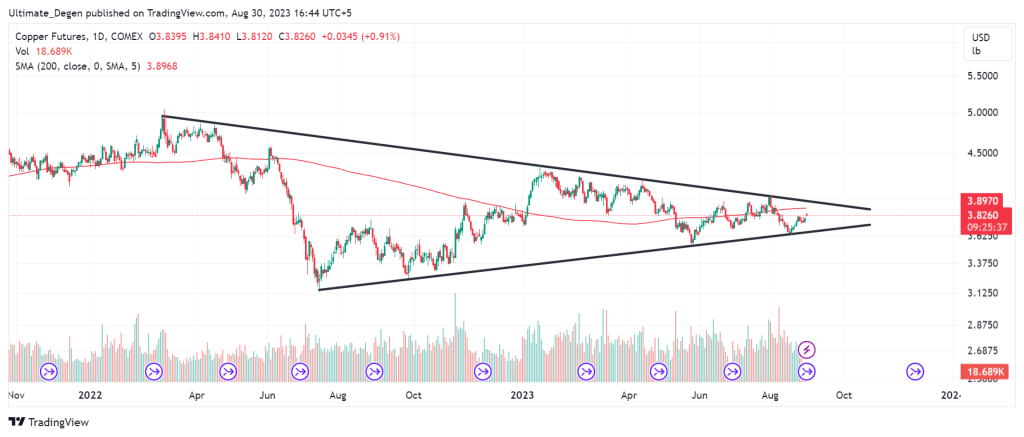
A look at the following chart reveals that the XCU/USD is printing a symmetrical wedge pattern on its daily chart. Right now, the price is heading for the retest of the 200-day moving average, which currently lies at $3.90. If the price breaks above 200 MA, bulls may target $4 in the coming weeks.
Copper price forecast will turn bearish in case of a rejection from the 200 MA. In that scenario, bears may target the bottom of the symmetrical wedge pattern, which currently lies around $3.69. Therefore, it is better to wait for a breakout or breakdown from the pattern before jumping into any position.