- Gold Price Chart is looking fairly bullish amid a weakening demand for US dollar. A new ATH seems to be only a matter of time.
The XAU/USD pair is looking very strong due to multiple headwinds. The falling bond yields and the decreasing inflation in the West have triggered a bull run in the Gold price. As a result, the precious metal bulls are now targeting new all-time highs.
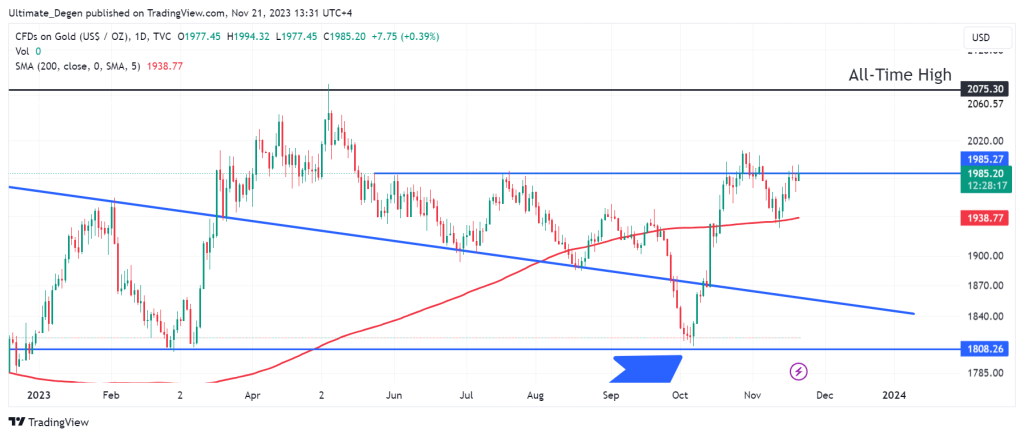
However, my only concern is the massive resistance and supply which lies just above $1,985. This level is proving to be a major hurdle for the bulls and the only obstacle that lies before a new all-time high.

On Monday, the precious metals had a pullback but the price action reversed on Tuesday. At press, time Gold and Silver prices were up 0.44% and 0.48%, respectively during their London session.
Gold Price Forecast & Technical Outlook
The following chart shows how strong the $1,985 resistance level is. The price is once again trying to break above this level. If this breakout occurs and the price closes a couple of days above this level, the Gold price may snap to its highest level in history very quickly.