
- Gold price rallied to all-time highs in October, but recent weeks have seen the metal loose some ground with the US dollar strengthening.
- Delayed release of key US economic data could have substantial impact on XAU/USD trajectory as it could inform the December Fed interest rate decision.
- The underlying market sentiment still favours gold despite recent pullbacks, with central bank appetite and geopolitical risk providing fuel.
Gold prices have indeed been sending mixed signals in recent weeks, leaving investors unsure of what’s next. As of this writing, the yellow metal is trading above $4,145 per ounce, bouncing back from a dip to around $4,000 earlier this month. This rise comes after a period of little movement, driven by worries about global tensions and anticipation of U.S. economic numbers.
Recent Price Movements
Several factors are at play here. Geopolitical flare-ups, including ongoing Middle East tensions, continue to support gold’s appeal as a hedge against instability. Meanwhile, upcoming U.S. releases, such as retail sales and core PCE inflation, could sway sentiment. A softer-than-expected report might revive rate-cut bets, propelling gold higher, while robust data could strengthen the dollar and pressure prices downward.
In the last couple of weeks, gold has been moving between $4,000 and $4,100, showing the uncertainty in the market. In early November, gold prices jumped over 6% to test resistance near $4,100, after the Federal Reserve hinted at possible rate cuts. However, a strong dollar and lower trading volumes during the holidays made things choppy, limiting gains and causing brief drops to $4,022 on November 24.
Is a Deeper Correction a Risk?
Even though the overall gold price trend is still upward, a bigger drop is possible. Analysts at firms such as Goldman Sachs and UBS predict prices will rise to around $5,000 in the coming years, but a correction is still a risk.
A significant correction could happen if the Federal Reserve makes very hawkish statements or if the U.S. economy shows surprisingly strong data, causing the dollar to rise substantially. If this happens, gold could test its support levels. Though, because central banks are still buying gold and geopolitical issues are still present, many analysts think that any dips toward major support zones will be seen as buying opportunities by long-term investors.
Gold Price Chart
Gold price is currently consolidating. The long-term uptrend is validated by the price trading significantly above the 20, 50 and 200-day Simple Moving Average (SMA), which provides structural support far below current levels.
The key support area is at the psychological $4,000, which also corresponds to the 50-day SMA. Below that level, XAU/USD could go lower and test $3,930, signaling a break in the intermediate uptrend. On the upside, immediate resistance is around $4,180 – $4,250. A clear break above that level would signal a renewed attempt to move towards the recent record highs.
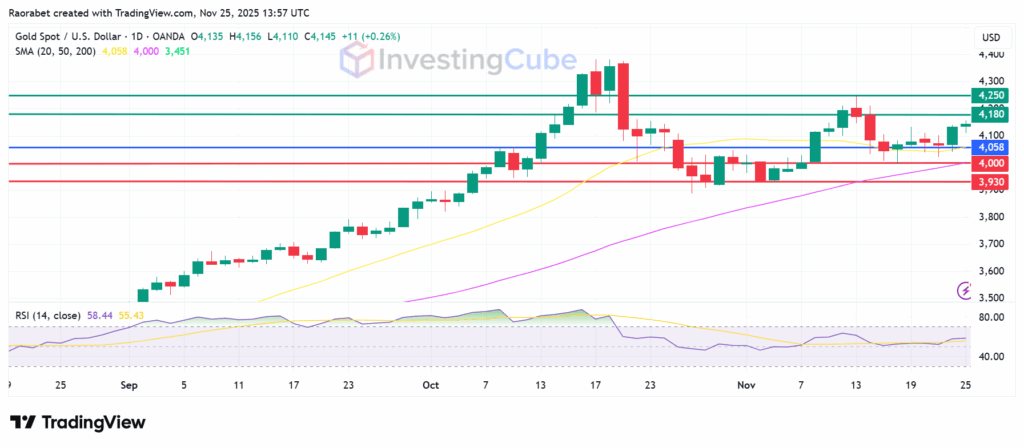
Gold price daily chart at the spot market as of November 25, 2025 with key support and resistance levels. Created on TradingView
The most significant structural force is the persistent, heavy accumulation of gold reserves by global central banks as part of a diversification strategy.
Most strategists view the recent pullback as a necessary and healthy technical correction and profit-taking phase following its sharp October rally, rather than a full trend reversal.
Yes, robust retail sales or PCE figures might bolster the dollar, pressuring gold toward $4,000; weaker prints could sustain the uptrend.