
- Gold is showing short-term bullish momentum after breaking above 4362, supported by technical indicators like the RSI.
- US–Venezuela tensions are boosting safe-haven demand, adding upside pressure to gold prices.
Despite the new year and Christmas holiday, Gold’s volatility was key last week. The gold prices hovered above 4,500$ before dropping below 4,400$. Silver prices also witnessed more than 10$ range. The gold continuous contract advances by 2.61% or 113.20 points.
On the other hand, the silver continuous contract also advances by 6.44% or 4.58 points. These positive movements in gold and silver prices reflect increased inflows into safe havens. The key driver for such inflows was that the US took control over Venezuela.
This article explores major factors influencing gold prices, along with the key US macroeconomic data to watch this week for the gold price outlook.
What Influences Gold Prices? Key Factors Explained
- On Saturday, the US Army’s Delta Force, with an elite special forces unit, attacked Venezuela and arrested its President, Nicolas Maduro, and his wife.
- Donald Trump’s target is Venezuela’s huge oil reserves and the commercial opportunity they represent to US oil companies. This is the primary motivation for removng president Nicolas Maduro.
- Moreover, the US President Donald Trump openly announced that Colombia and Mexico could also face US action. This action is considered to be a part of a widening campaign against criminal networks and regional instability.
- It seems that Trump will not stop at Venezuela as he has warned:
- Mexico to “get its act together” on security and drug trafficking.
- Trump said Cuba “Looks ready to fall” and has criticized its support for Venezuela’s government.
- He also made controversial comments about (Greenland / Denmark) that it is possibly pursuing control of it for strategic reasons.
- Apart from this, there is no progress in the Russia-Ukraine peace deal, tension in Iran remains intact, and unrest in Gaza.
- The ongoing geopolitical tensions boost safe-haven assets like gold and silver by the start of a new week.
US-Macroeconomics Data to Watch:
- Moreover, the rising bets on further Fed rate cuts and a dovish Federal Reserve this year have become another factor boosting the yellow metal.
- Market participants expect borrowing costs to be lowered in March by the US Federal Reserve.
- The market also focused on an aggressive easing approach from a Trump-aligned Fed chair. This is outweighing the Fed’s view of only one rate cut this year.
- This week’s releases are very important as it includes:
- The US Nonfarm Payroll Report on Friday.
- The US inflation data: ISM Manufacturing PMI for December will be released later today.
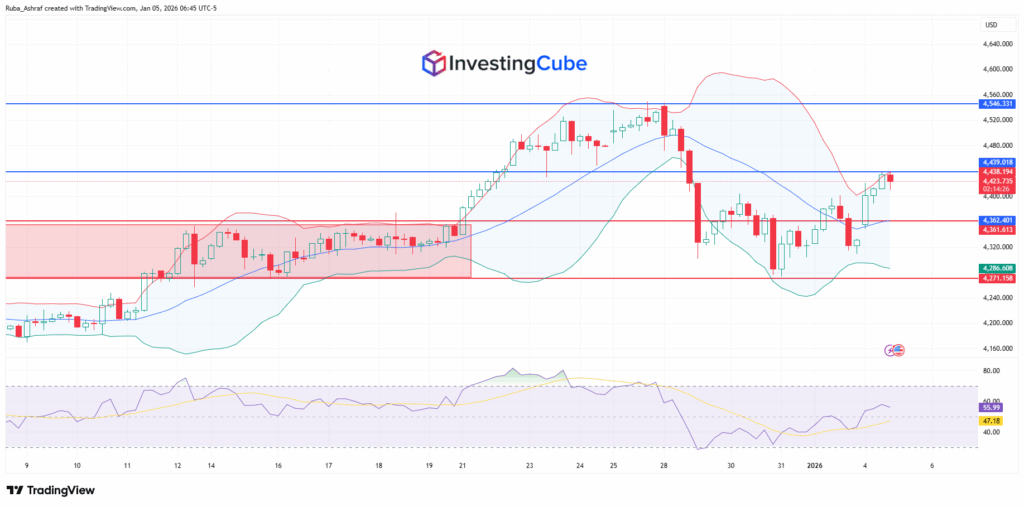
Gold Price Technical Outlook:
The chart shows a recent bullish recovery after a sharp correction. The price initially consolidated in a range between 4270 and 4362, the area highlighted by the red rectangle. During early trades today, the gold price successfully broke out above 4362. This breakout suggests bullish momentum above the middle bollinger band. The gold price is currently testing the resistance of the upper Bollinger Band at 4437.
A clear 4-hour close above 4437 could pave the way toward 4480 and then 4500. The RSI has climbed above 50 to around 55, indicating mild bullish momentum but not yet overbought, which aligns with a cautious upside potential while facing resistance at 4,439. Overall, the chart suggests a short-term bullish bias within a broader range, with the 4,362 support and 4,439 resistance levels being key to watch.
Gold rises a investors seek a safe-haven assests during geopolitical tensions.
Key levels are 4362 for support and 4439 for resistance, guiding short-term moves.