
Gold is trading at $4,668 on the Monday London session after a $1,000 crash from its record peak of $5,608 last Thursday. The move from $5,608 to $4,668 is not merely a technical correction; it is a structural “reset” of the precious metals market.
The primary driver is the “Warsh Factor.” Market participants view Kevin Warsh as a monetary hawk likely to prioritize balance sheet discipline and inflation control over open-ended liquidity. This shift in Fed leadership expectations has caused US Treasury yields to surge, making the non-yielding yellow metal less attractive.
Additionally, as reported by Bloomberg, the “crowded trade” in precious metals reached a breaking point, forcing a massive liquidation as traders unwound bets on a weaker dollar and unconstrained inflation.
Why Gold Fell $1,000 in Two Days
This selloff is not being driven by a collapse in long-term demand. Instead, it reflects a liquidity shock.
As reported by Reuters, gold and silver have both come under pressure as margin calls spread following President Donald Trump’s nomination of Kevin Warsh as the next Federal Reserve Chair. Markets are now rapidly repricing toward a more hawkish Fed outlook, pushing US Treasury yields and the dollar sharply higher.
Higher yields are toxic for non-yielding assets like gold. As the dollar surged, leveraged positions were forced to unwind, accelerating downside momentum.
Crucially, gold was not sold because it “failed” as a safe haven. It was sold because it became a source of liquidity.
Margin Calls Turn Correction Into Capitulation
The intensity of gold’s decline cannot be separated from what happened in silver.
Silver’s historic collapse triggered widespread margin calls across commodity desks. As traders scrambled to raise cash, profitable gold positions were liquidated to cover losses elsewhere. This dynamic transformed a controlled retracement into a disorderly selloff.
While gold remained far more resilient than silver in percentage terms, the absolute dollar move was staggering. A $1,000 drop in two sessions is extremely rare for the metal and underscores how leveraged positioning had become near the highs.
Gold vs Silver: Why Gold Still Looks “Stronger”
Despite the brutal drop, gold has outperformed silver decisively.
Silver collapsed roughly 35% in just two days, while gold has fallen about 16% from its peak. The divergence reflects positioning, not fundamentals. Gold continues to benefit from central bank demand, reserve diversification, and long-term inflation hedging flows.

Silver, by contrast, had become heavily dominated by speculative and retail leverage, leaving it far more exposed once margins tightened.
In short, gold broke hard, but silver broke violently.
Gold Technical Outlook: Key Levels After the Crash
From a technical perspective, gold has entered a high-volatility reset phase.
- Immediate Support: The $4,600–$4,650 zone is now critical. This area represents the first major demand band after the breakdown.
- Downside Risk: A sustained break below $4,600 could expose $4,400, where buyers previously defended price aggressively.
- Resistance: Any rebound is likely to face heavy selling near $4,950, followed by the psychological $5,000 level.
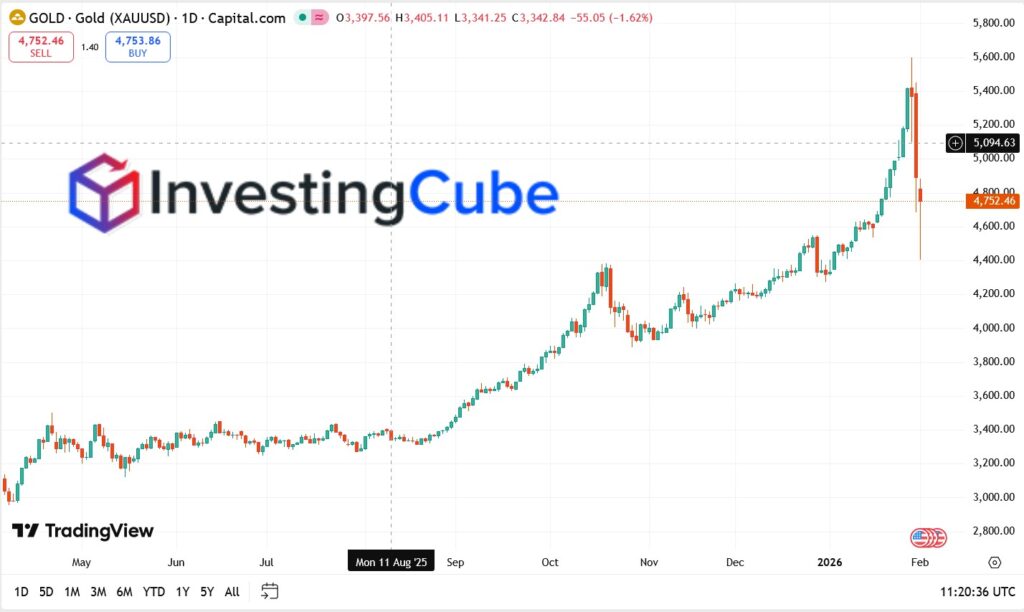
XAU/USD daily chart highlighting Gold’s sharp reversal from the $5,600 toward the $4,680 region in early February 2026. Source: TradingView.
Conclusion: Gold’s Safe-Haven Status Tested, Not Broken
Gold’s $1,000 collapse has shocked markets, but it does not mark the end of the bull cycle. Instead, it signals a violent reset after an unsustainably crowded rally.
As the market digests a stronger dollar, tighter financial conditions, and shifting Fed expectations, gold must rebuild a base before any durable recovery can take hold. Compared with silver, gold remains structurally supported, but the era of one-way upside has clearly ended.
The next phase will be defined by how quickly liquidity stabilizes and whether central bank demand continues to absorb supply at lower levels.
Gold FAQs
Gold fell due to forced liquidation and dollar strength, not collapsing demand. Margin calls and rising yields outweighed traditional safe-haven flows.
Statistically, yes. During this “Monday Meltdown,” Gold fell approximately 16% from its peak, while Silver suffered a far more catastrophic 35% crash. Gold’s deeper liquidity and central bank backing make it the more resilient asset.
The long-term outlook remains constructive, but the short-term trend has reset. Gold needs time to stabilize before a sustainable recovery can develop.
