

- Stay informed on the geopolitical tensions and supply chain challenges impacting crude oil prices and the dynamics of OPEC+ and non-OPEC.
A tug-of-war between geopolitical disruptions and soft structural fundamentals currently shapes the global crude oil market. Crude oil traders have to look carefully at the main drivers of prices to anticipate price direction. Below is a breakdown of the key factors driving crude oil prices today:
The ongoing geopolitical risks and supply disruptions:
The current closure of the Strait of Hormuz has caused a massive shortage in the supply. This is putting roughly 20% of the world’s global crude oil supply at risk. Moreover, Saudi Aramco has warned that this situation threatens a loss of up to 100 million barrels of supply every week. Such supply disruption has driven crude oil prices to increase since the Mideast tensions started.
Meanwhile, the headlines out of Washington and Tehran led crude oil prices to experience sharp intraday swings. Any signals of ceasefire talks or diplomatic progress drag prices down. On the other hand, supply concerns are quickly ignited by breakdowns in talks.
The Battle of OPEC+ vs. Non-OPEC Production:
OPEC Secretary General Haitham Al Ghais has pushed back firmly against increasing market skepticism over oil demand, saying the organization has yet to see any evidence of a meaningful slowdown and is standing by its forecast for consumption growth of 1.2 million barrels per day for 2025.
On the other hand, the non-OPEC oversupply risks are looming: OPEC is bullish on the long-term forecast, in stark contrast to the bearishness coming from institutional desks like J.P. Morgan and the EIA. They say this is due to an inventory build that has been driven by soft underlying global demand and expanding non-OPEC production that could outstrip demand later in the year.
Crude Oil Price Technical Outlook:
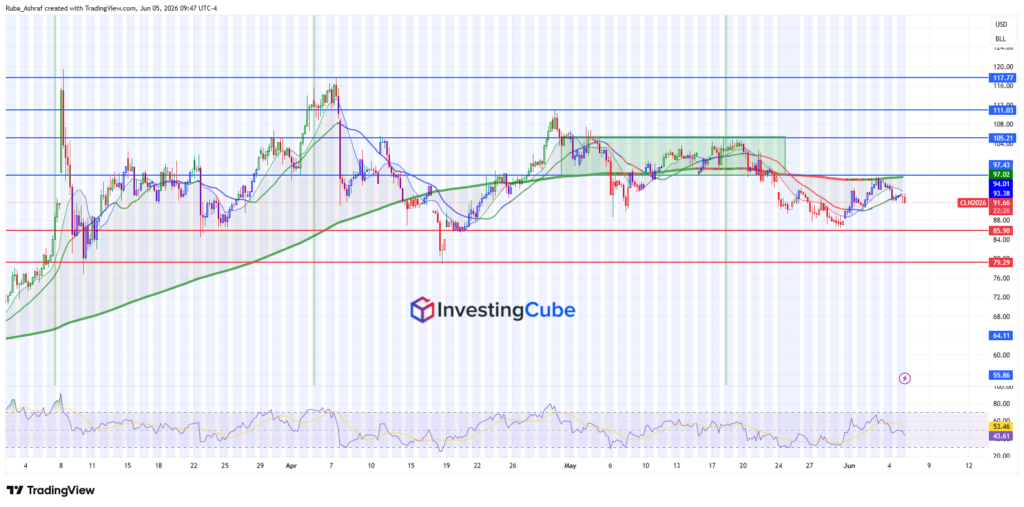
The crude oil chart shows a market that remains locked within a broader consolidation range and has failed to extend the strong rally seen in April. Prices have rebounded from recent lows close to $89, but the recovery remains technically fragile, with crude still trading below a number of key resistance levels.
The range-bound structure between $97.43 and $105.21, indicated by the green rectangle, is the chart’s most prominent feature. These boundaries were consistently upheld by buyers and sellers throughout May, creating a clear consolidation zone. But the breakdown that followed below $97.43 turned that level into the first significant resistance and moved the short-term bias lower.

Crude oil is currently trading in the $93.40–$94.00 range, close to the intersection of its rising 200-period moving average and its shorter-term moving averages. Bulls and bears are using this area as a major battlefield.
Although prices recovered above the shorter-term moving averages thanks to the recent rebound from the $89 region, the inability to firmly regain $94.00 indicates that bullish momentum is still limited.
The RSI is hovering around 49, almost exactly at the neutral 50 mark. This reflects the lack of strong directional momentum and confirms that the market is currently in a consolidation phase rather than a sustained trend. Neither buyers nor sellers have established clear control.
Key Resistance Levels:
- $94.01: Immediate resistance and a critical pivot zone.
- $97.43: Former range support that has now turned into major resistance.
- $105.21: Upper boundary of the previous consolidation range.
- $111.03 and $117.77: Longer-term bullish targets if upside momentum accelerates.
Key Support Levels:
- $89.00-$90.00 region: Recent rebound area and near-term support.
- $85.90: Major downside support and previous swing low.
- $79.29: Critical long-term support if bearish momentum intensifies.
Bullish Scenario:
For the bullish outlook to strengthen, crude oil must secure a sustained move above $94.01. Such a breakout would signal improving buying pressure and expose $97.43, the most important resistance level on the chart. A decisive break above $97.43 would suggest that the recent selloff was merely corrective and could open the door toward $105.21.
Bearish Scenario:
If prices fail to hold above the moving-average support zone and fall back below $90.00, sellers could regain control. In that case, the market may retest $85.90, with a deeper decline potentially targeting $79.29. A break below $85.90 would reinforce the bearish medium-term structure and indicate that the broader correction is not yet complete.