
Brent crude oil price trade lower for the fourth consecutive trading session as the risk-off sentiment pressures crude oil to the lowest level since July 30. Weak economic data from Europe’s biggest economy weigh on oil price today.
German Industrial Production Below Expectations
The German Industrial Production increased 1.2% on a monthly basis in July below the forecasts of +4.8%. The annualized Germany Industrial Production non seasonally adjusted came in at -10% well below the estimates of 12.1%, the June reading was at -11.7%.
Some support to crude oil provides better than expected numbers from China’s exports which shows that the global demand is gaining momentum and might also support the demand for crude oil products. Positive news on the coronavirus vaccine might also help oil price as Russia’s vaccine will conclude the clinical trials of the coronavirus vaccine by September 30.
The stronger dollar is the main factor that pushes oil price to monthly lows the last week, while news that Iraq is seeking an exemption from the crude oil production cuts weigh on the price.
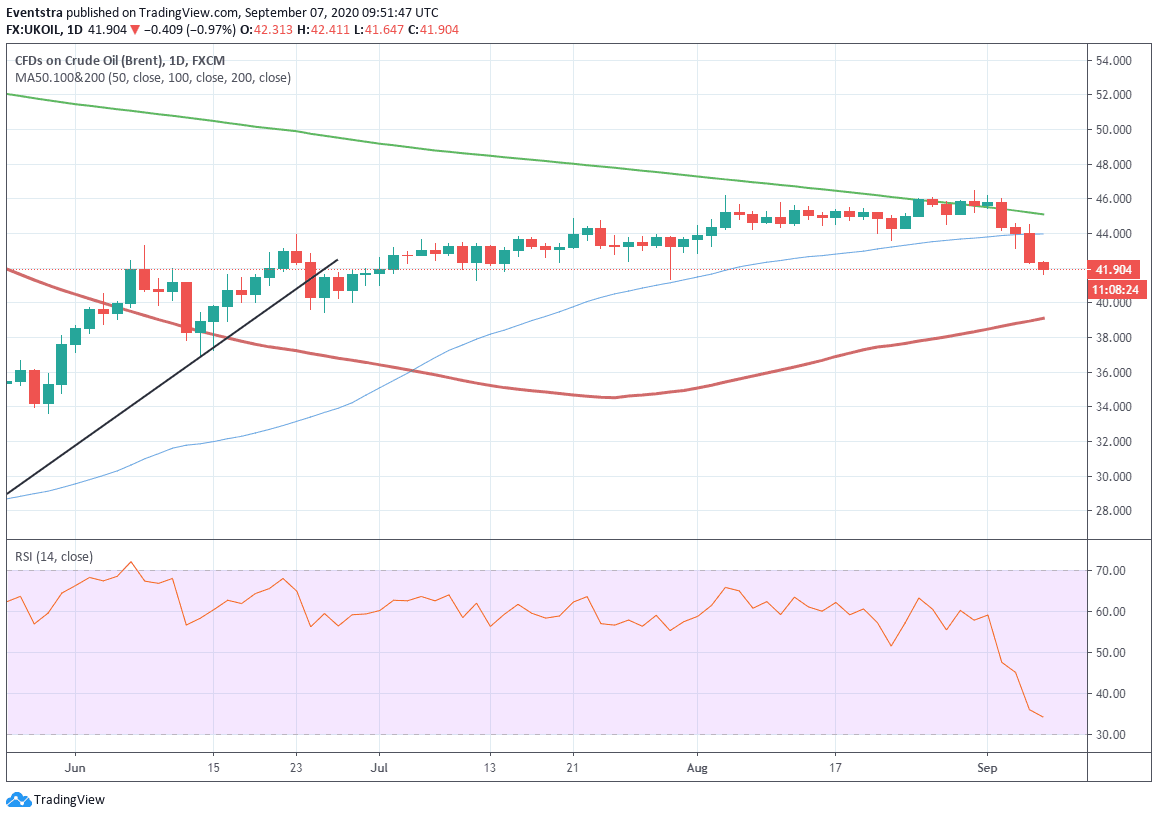
Brent Oil Daily Technical Analysis
Brent crude oil price is 0.71% lower at $42.00, marking the lowest level since July 30 as the technical picture points to lower levels. As I have mentioned in the previous crude oil article: Brent Crude Oil Price Retreat As Bears Show Teeth.
Support for the black gold stands at $41.64 the daily low. More bids would emerge at $40.99 the low from July 1. The 100-day moving average at $39.10 would provide the next support zone, which if breached might accelerate the correction towards the $35 mark.
On the upside, resistance for the crude oil price is at 42.41 the daily top. More sellers might emerge at 43.97 the 50-day moving average. A break above might challenge the strong obstacle at the 200-day moving average at 45.10.
Don’t miss a beat! Follow us on Telegram and Twitter.
Brent Crude Oil Price Daily Chart
More content
- Download our latest quarterly market outlook for our longer-term trade ideas.
- Follow Nikolas on Twitter.
- Do you enjoy reading our updates? Become a member today and access all restricted content. It is free to join.