


- The BTC to GBP pair is starting to show signs of impending bearishness as the rising wedge starts to form on the daily chart.
- BTC/GBP has posted progressively lower highs in the last 4 days.
- Emerging rising wedge could indicate a coming near-term correction.
- BTC to GBP price action has to beat 47201 to restore bullish bias.
The BTC to GBP pair is still consolidating within a tight range, following the burst into record territory in October. However, the price picture on the daily chart could be pointing towards a correction, except the bulls come into the market with additional momentum.
Whether this momentum can come in before a correction sets in has been put in some doubt after Cryptoquant CEO Ki Young Ju said that whales intending to sell were the ones making the largest deposits to exchanges. For now, Bitcoin continues to hold above critical support at 43917.
As of writing, BTC/GBP is down 0.37%.
BTC to GBP Outlook
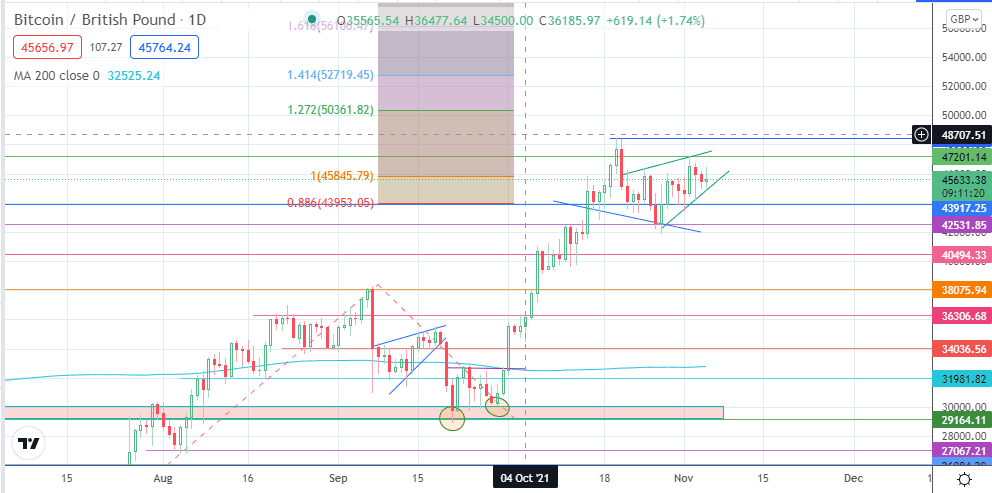
The emerging pattern on the BTC to GBP daily chart is that of a rising wedge. This scenario could have bearish ramifications on the pair, given that the last four candles have shown progressively lower highs. The wedge’s breakdown will also need to take out 43917 to bring 42531 into the picture as the initial downside target. The measured move is expected to end at 40494, but an extension of the decline could target 38075 and 36306 in succession.

On the flip side, a break above 47201 must also take out the all-time highs at 48433 to restore bullish sentiment on the BTC/GBP pair. This could open the door towards 50361 (127.2% Fibonacci retracement), with 52719 (141.4% Fibonacci extension) also lining up as a potential upside target if the BTC/GBP pair extends further into record territory.
BTC/GBP: Daily Chart
Follow Eno on Twitter.