

- BP share price has done well in 2022 supported by the soaring oil and natural gas prices. The stock has jumped by 33% year-to-date
BP share price has done well in 2022 supported by the soaring oil and natural gas prices. The stock has jumped by 33% year-to-date, meaning that it has outperformed the FTSE 100 and the Vanguard Energy ETF (VDE). The stock has also done better than small-cap energy companies like Tullow Oil and Capricorn.
What next for BP?
BP has had a mixed year so far. First, the company has benefited from the relatively elevated oil and gas prices. Brent, the global benchmark, is trading at $93, which is much higher than where it was in 2020. Still, this price is substantially lower than its year-to-date high of $135. Gas prices have surged to a record high following Russia’s invasion of Ukraine.
As a result, the company’s financials have done modestly well in the past few months. For example, the company’s second-quarter profits jumped to a 14-year high in Q2 to over $8.45 billion. As a result, the company decided to boost its dividends by 10%. It also boosted share repurchases to $3.5 billion, adding to the $3.8 billion it bought in the first half of the year.
Further, the company announced that it had reduced its total debt dramatically. It now has a net debt of over $22.7 billion, which was lower than the previous $32.7 billion. Therefore, there is a likelihood that the company will continue doing well in the coming months.
BP share price rose as the company made some moves in the US. On Monday, BP North America said that it acquired EDF Energy Services from EDF. EDF is a French utility company. In a statement, the company said that the deal will help it to expand its footprint in the US commercial and industrial retail power and gas prices.

BP share price forecast
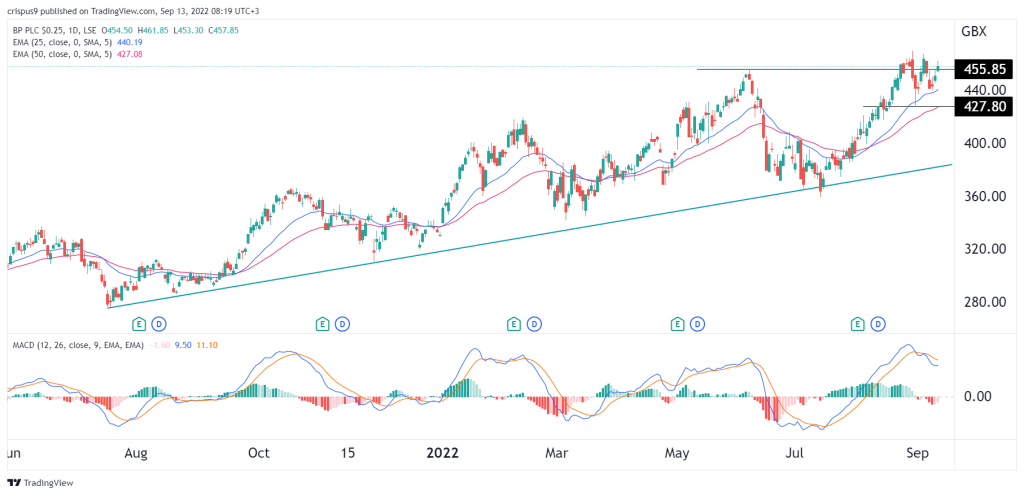
The daily chart shows that the BP stock price has been in a strong bullish trend in the past few months. It has moved above the ascending trendline shown in green. The stock has moved above the 25-day and 50-day moving averages while the MACD has moved above the neutral point.
At the same time, the stock has formed what looks like a cup and handle pattern. Therefore, the stock will likely continue rising as bulls target the next key resistance level at 500p. A move below the support at 427p will invalidate the bullish view.