
- The Boohoo share price has been in a strong sell-off as multiple concerns about the stock remain. What next?
The Boohoo share price has been in a strong sell-off as multiple concerns about the stock remain. The BOO stock is trading at 112.90p, which is about 75% below the highest level in 2020. It is trading at the lowest level since December 2016.
Boohoo is a leading fashion brand that is known for selling low-priced items in the UK and other countries like the United States. It has a well-defined production strategy that ensures that the firm’s low-priced pieces are still profitable.
The past two years have been difficult for Boohoo. While its business has seen strong growth, the company has faced some external challenges. For example, the company was accused of bad labor conditions in its plants. It has also faced a global supply crisis that has affected its business. Most importantly, the firm is facing strong competition.
Still, there are signs that the stock has moved to the oversold level. Besides, most analysts who cover the stock have a favourable rating on the stock despite the recent challenges.

Boohoo share price forecast
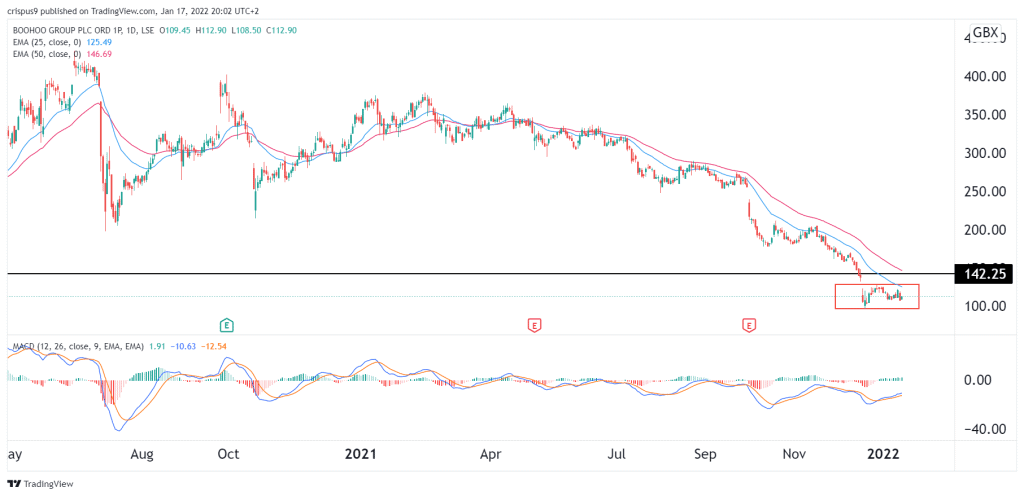
The daily chart shows that the BOO share price has been in a strong bearish trend in the past few months. As a result, the stock has moved below the 25-day and 50-day moving averages. The MACD has also declined sharply. A closer look shows that the stock has formed an island reversal pattern that is shown in red. In technical analysis, this pattern is usually a sign of a bullish reversal.
Therefore, a contrarian case can be made considering that the worst-case scenario has already been priced in. If it happens, the next key level to watch will be at 200p, which is significantly higher than the current level.