- Bitcoin price is slowly making a comeback as it continues defying gravity. We explain what to expect next amid this rally
I wrote my first Bitcoin price prediction for 2023 three weeks ago. It was wrong. At the time, I predicted that BTC would have a bumpy first quarter followed by a spectacular performance in Q1 followed by a strong recovery in the second half of the year. At the time, I said that BTC would waver between $13,000 and $20,000 in Q1. Instead, the opposite happened and the coin cruised above $23,000 for the first time in five months.
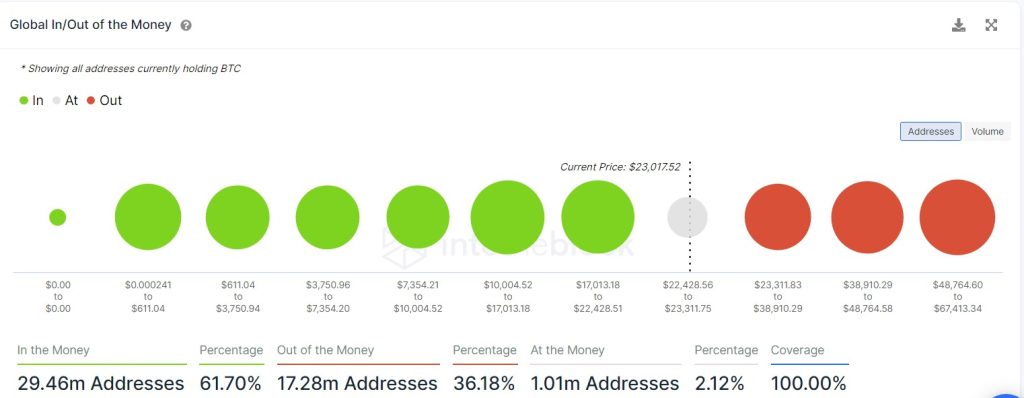
Most BTC holders are profitable
Bitcoin holders and miners are also doing well as they move to profitability. According to Into the Block (subscription needed), 29.46 million Bitcoin addresses are in the money, representing about 61.70% of all holders. The breakeven point is about $23,000. This performance has been triggered by falling American inflation and enthusiasm about a potential Fed pi pivot.
Another on-chain metric to consider is the number of transactions in Bitcoin’s network. In most periods, Bitcoin does well when the level of activity is doing well. Bitcoin, despite its terrible performance in 2022, had a stable activity performance. On average, the number of daily transactions are averaging over 293k. And the figure is rising, which is a positive thing.
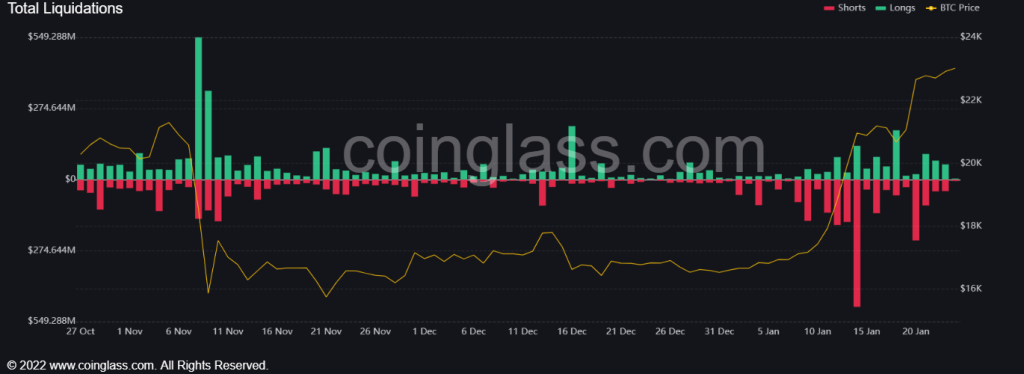
However, it seems like the longs and shorts liquidators have moved to parity. On January 14, we saw the biggest shorts liquidations in months, which partly explains why BTC price soared. Recently, however, as you can see below, there is an equilibrium of longs and shorts liquidating their positions. On Monday, we saw $55 million of longs liquidated compared to $44 million of shorts.
Bitcoin price prediction
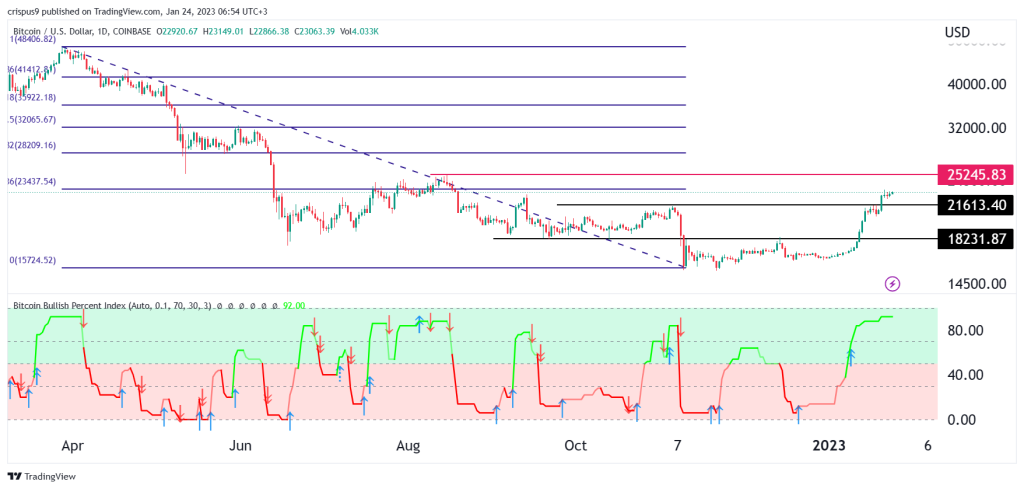
Technical analysis is an excellent way to predict whether the current rebound will last. Turning to the 1D chart, we see BTC price has continued making higher highs in the past few days. During this rebound, it managed to cruise above the psychological point at $20,000. In most periods, a point like $20k has some more weight because most people pay a close attention to it.

BTC/USD also jumped above $18,231 (September 2021 low) and $21,613 (pre-FTX crash high). Therefore, it managed to invalidate the double-top pattern that has been forming. It is now sitting at the 23.6% Fibonacci Retracement level and has crossed the 50-day moving average. The bitcoin bullish percentage indicator has surged above 80, signaling that there is still momentum.
A clear break above this Fib resistance will bring the next resistance at $25,245 to view. This price is about 10% above the current level. On the flip side, a penetration below the support at $21,613 that is supported by high volume, will signal that sellers have prevailed and will see it drop to about $20,000.