Our Bitcoin price prediction is hanging by a thread as the price is struggling to stay above the $20,000 level. BTC price appears to have a range bound between $19,000-$22,000 levels. Additionally, the release of the June CPI report has further increased the volatility as the markets are pricing in the highest inflation in decades. Due to the record-breaking inflation, many analysts are anticipating another leg down before a proper reversal.
According to Bitcoin news, JP Morgan said that the mining cost has decreased from $24,000 to $13,000. This suggests that even at the current price level, many miners might be taking profits. The network hashrate still stands strong at over 200 million TH/s. While Bitcoin price is trading 71% below its ATH, the mining hashrate is only 13% down.
It is worth mentioning that the Bitcoin price has been downtrend since hitting the all-time high of $69k in November 2022. The major factors contributing to this downtrend are the recession fear and the recent back-to-back rate hikes by US FED. However, as inflation has kept increasing despite the rate hikes, many analysts fear the worst is yet to come for BTC price.
Bitcoin Price Prediction
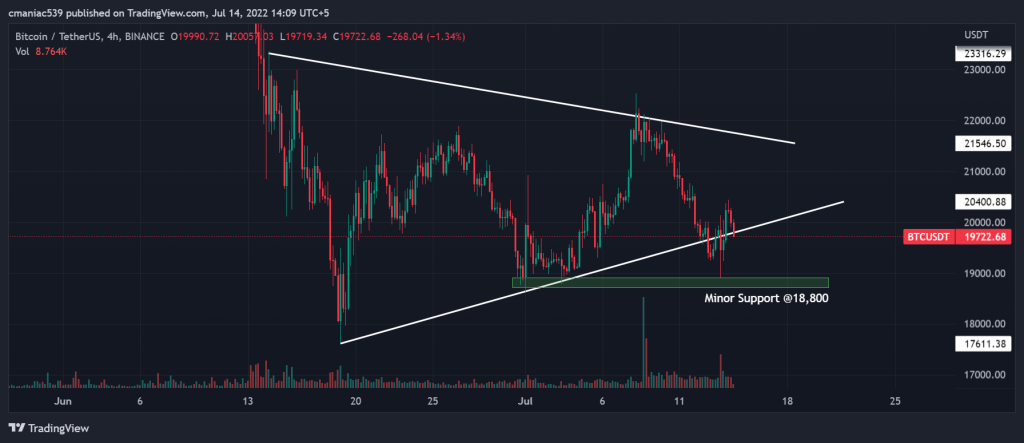
Technical analysis of the BTC USD price chart shows that the price is forming a symmetrical wedge at a 4-hour timeframe. The price briefly broke below this wedge after the release of the inflation report yesterday; however, it immediately clawed back upwards. Nevertheless, after a rejection from the $20,400 level, the price is back below $20,000 once again and now trading at $19,750.
If the price gets acceptance below the symmetrical wedge, then this breakout might potentially tank the price to $14,700. This Bitcoin price prediction comes into play by taking the measured move of this breakout. On the other hand, an upward breakout could take the price to $26,000 in the short term. First, however, BTC would need to overcome the massive resistance that lies around the 22,000 level.
BTC USD 4H Chart
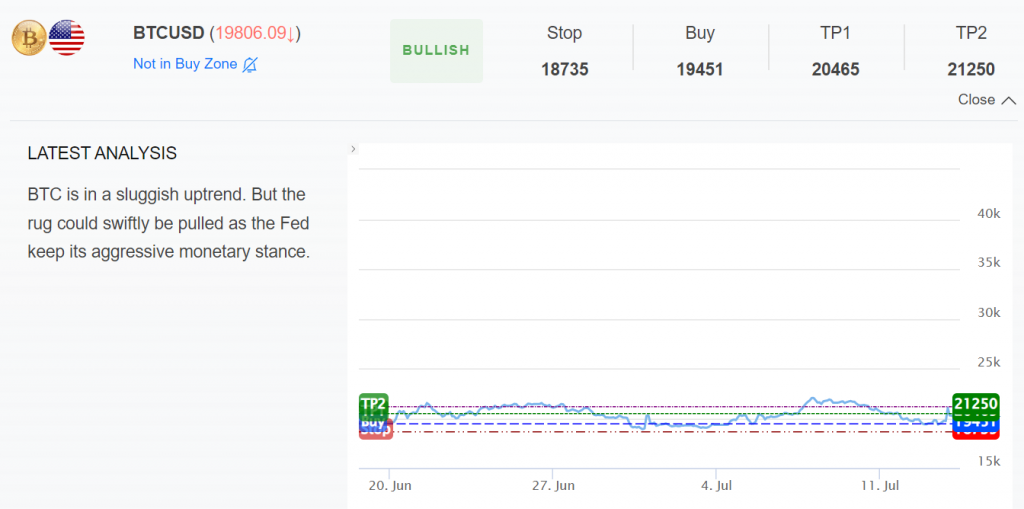
InvestingCube Premium S&R Levels
If you’re trading in these uncertain and tough market conditions, then subscribing to Investingcube’s S&R Indicator could give you a great edge. This premium indicator notifies you in real-time about different trade setups along with the corresponding price targets.
The indicator is currently signalling a potential long from $19,451 with a stoploss at $18,735. This stoploss is in alignment with the $18,800 support level as indicated in our Bitcoin price prediction. You can trade this setup on exchanges like Binance, Kucoin and Bybit etc.