

- Bitcoin price retreated on Tuesday as the recent recovery found a strong resistance at $21,888. BTC/USD price has pulled back to 20,616
Bitcoin price retreated on Tuesday morning as the recent recovery found a strong resistance at $21,888. The BTC/USD price has pulled back to 20,616, which was the lowest level since June 24th. It has fallen by over 7.50% from the highest point this month. A quick look at the industry shows that most coins like Bitcoin and Cardano have also pulled back.
Bitcoin’s pullback coincided with a similar retreat from American indices like the Dow Jones and Nasdaq 100. The two declined by over 100 points after they surged hard during the previous week. It is unclear why stocks declined since there was no major news on Monday. A likely reason was the upcoming rate hikes after the US published strong pending home sales and durable goods orders. In the past few days, there has been a close correlation between stocks and Bitcoin.
A closer look at the options market shows that Bitcoin’s put-to-call ratio has diverged with that of Ethereum. It has risen to about 0.70 while Ether’s has dropped sharply in the past few days. A higher put-to-call ratio is usually a sign that more investors in the options market are a bit bearish.
Bitcoin price also pulled back after signs emerged that FTX was pivoting to stocks. It was reported that Sam Bankman’s company was considering a bid for Robinhood, the embattled broker. The company is in trouble after the SEC unveiled plans to end the payment for order flow (PFOF) business model.
Bitcoin price prediction
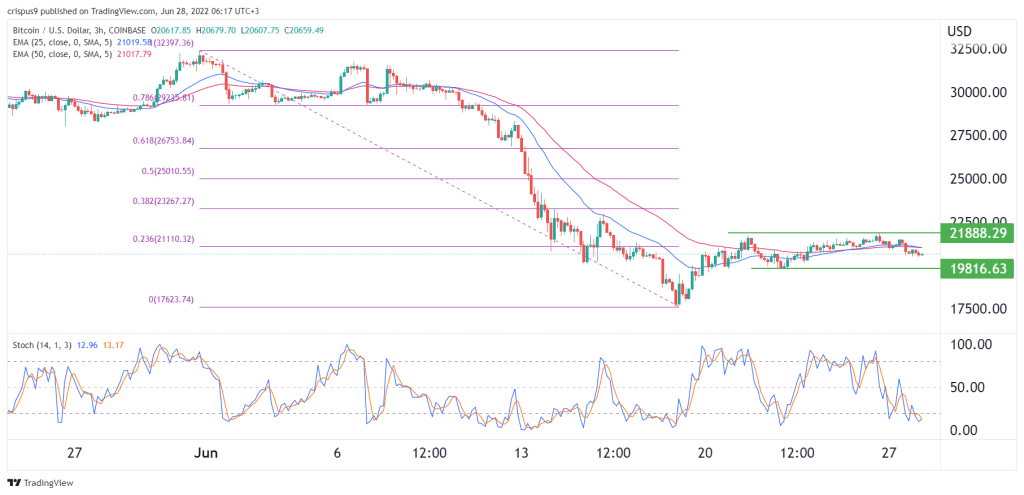
The BTC/USD price crashed hard earlier this month as demand for the coin wavered. It fell to a low of 17,616, which was the lowest level since March last year. The coin then pulled back and rose to a high of 21,888 as investors bought the dip. Now, Bitcoin has struggled moving above that level.

On the three-hour chart, the BTC price has moved slightly below the 25-day and 50-day moving average while the Relative Strength Index (RSI) has moved below the oversold level. Therefore, the path of the least resistance is bearish since BTC has formed a double-top pattern. The next key level to watch will be at $19,816. A move above the resistance at $21,888 will invalidate the bearish view.
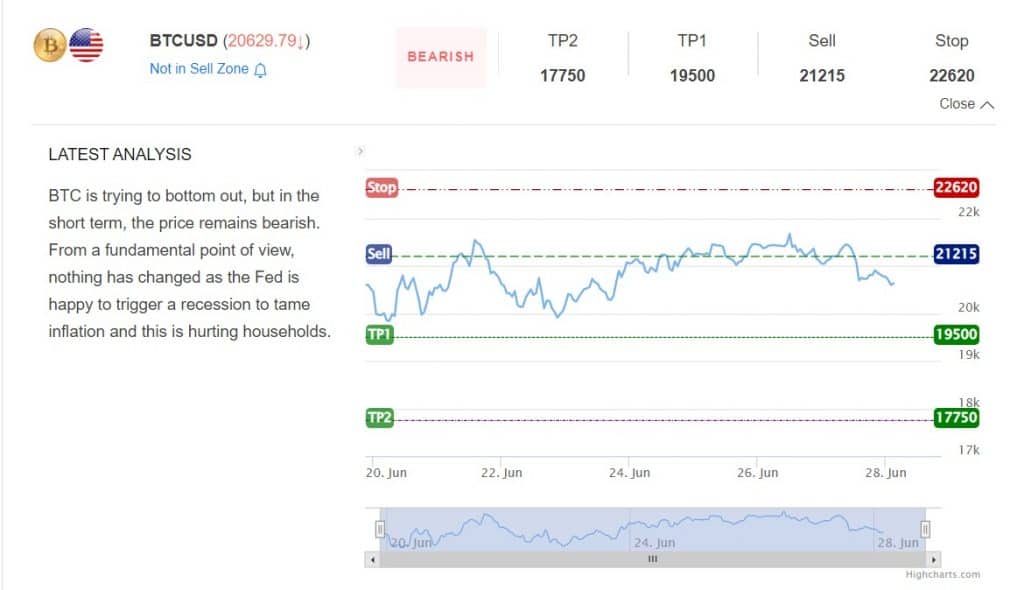
BTC support and resistance
This prediction is in line with InvestingCube’s S&R indicator. It has a bearish view with potential profit levels at $19,500 and $17,750. Subscribe to this highly accurate indicator to automate your trading with ease.