


- Bitcoin prices fall nearly 7% in two days, but the Bitcoin price prediction shows that the trendline at 58363 is key to further price action.
- Bitcoin prices plummet 7% in 2 days, taking out $500m worth of long positions.
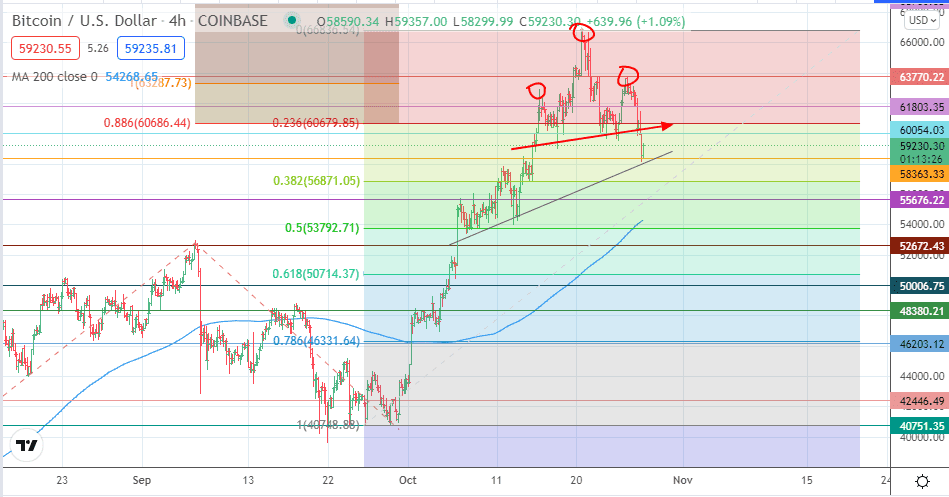
- Correction followed head and shoulders pattern on 4-hour chart.
- Ascending trendline that intersects 58363 support stands between recovery and further plunge.
The Bitcoin price dropped to as low as 58,100 this Wednesday, marking a correction that ended up liquidating nearly $500m in Bitcoin long positions.
The correction was not a surprise to those adept at trading the peaks and troughs of price action as first described by Charles Dow nearly 86 years ago. However, the trend for Bitcoin remains bullish, and what has been seen is not a reversal but rather a market correction triggered by profit-taking.
The price action had shown signs of a reversal on Tuesday, as the bull consistently struggled for upside momentum above 62800 – 63000. After two failed attempts at crossing beyond 63770 (22 and 25 October peaks), the selloff ensued as stops on long positions were taken out by profit takers.
Here is the potential playbook as indicated in this Bitcoin price prediction, which remains conditional.
Bitcoin Price Prediction
The 4-hour chart is used for this analysis. The head and shoulders pattern was the trigger for today’s correction. The measured move from the corrective topping pattern points to 56870 as the potential completion point. However, a trendline connects the lows of 7-13 October with the intraday low at 58363. This trendline needs to give way for the measured move to target the completion point. 55676 and 52792 (50% Fibonacci retracement from the 29 September low to the all-time high of 20 October) are additional targets to the south.
On the flip side, a bounce at 58363, which scales the resistance at 60054/60690 (neckline of pattern) truncates the correction’s progression. Instead, price action will focus on the 61800 and 63770 resistance barriers, which stand before the all-time high at 66999. 68763 is expected to turn up as a new target once the current all-time high is breached.
BTC/USD: 4-Hour Chart
Follow Eno on Twitter.