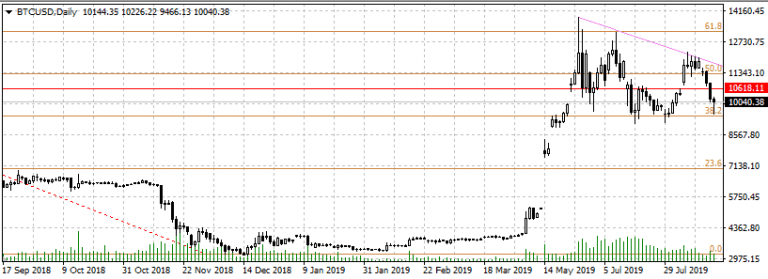
As I predicted about two weeks ago when BTCUSD was pushing beyond $12,000, Bitcoin fell victim to the descending trendline resistance which started from the high of June 26, and continued through the highs of July 10 and the first week of August. Having failed to break above the $12,000 mark, the BTCUSD pair has made an aggressive push to the identified support levels of $11,300 and $10,618 (which it broke very easily). However, the pair came very close to hitting the 38.2% Fibonacci retracement of $9,840 before bouncing to the $10,058 price level as at the time of writing.
Technical Plays for BTCUSD
They Fibonacci retracement levels traced from the swing high of November 2017 to the swing low of December 2018 continue to define the support and resistance levels for BTCUSD. I expect the BTCUSD pair to retest the 38.2% Fibonacci retracement level of $9,840.
It should also be borne in mind that the 38.2% Fibo retracement level and the descending trendline resistance both define the borders of a symmetrical triangle. We are likely to see some more price interaction with these two boundaries before a defining break occurs. These interactions may occur over the next few weeks.Don’t miss a beat! Follow us on Telegram and Twitter.
Download our latest quarterly market outlook for our longer-term trade ideas.
Do you enjoy reading our updates? Become a member today and access all restricted content. It is free to join.