


- The Bitcoin cash prediction indicates the potential for a steep drop if the descending triangle is completed.
The last article that provided a Bitcoin Cash price prediction identified the $360 resistance as the rate-limiting step for a price advance. Since this last call, this resistance mark appears more distant from the price action than before. Not only have sequential rallies from the support zone that has 271.9 as a floor failed to reach this mark, but the highs are getting progressively lower.
The price activity is starting to evolve into a descending triangle, which could have more bearish implications for Bitcoin Cash. Two days of bullish action coming off a bounce on the support zone has quickly faded into two days of losses. With the BCH/USDT pair struggling to hang on to gains made earlier in the week, what is the current Bitcoin Cash price prediction?
Bitcoin Cash Price Prediction
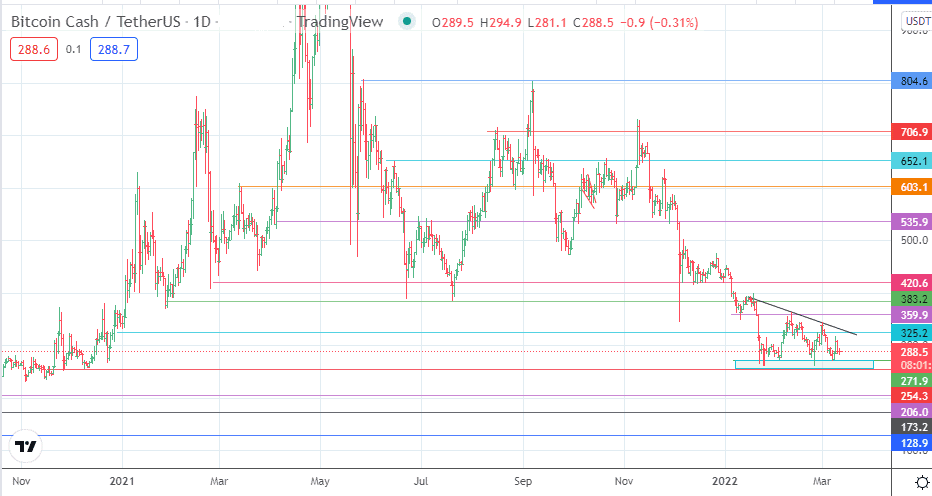
The evolving descending triangle will decide the pair’s fate in the coming weeks. A breakdown of the support zone at 271.9/254.9 completes the pattern and points to a measured move that targets completion at 128.9. To attain completion, the movement must degrade the pivots at 206.0 (2 September 2020 low) and 173.2 (12 March 2020 low).

On the flip side, a bounce on the support zone that takes out the 325.2 resistance will invalidate the pattern. This move would open the door towards 359.9, with 383.2 and 420.6 serving as additional targets to the north.
BCH/USDT: Daily Chart
Follow Eno on Twitter.