- Harmony One price predictions are set to take on a bearish tone if the pennant results in a downward trend continuation.
The evolving price action on the ONE/USDT chart indicates that the Harmony One price predictions could soon turn bearish. Today, the token is down 1.35%, which adds to Tuesday’s 3.84% loss. The decline in the day’s price has brought about a vulnerability in the support provided by the 0.03997 price mark, where recent lows of the past one week have been recorded.
Several altcoin charts indicate the same price picture: prices pushing towards multi-year lows on the back of evolving bearish patterns. The ONE/USDT pair is no different, as the pair is trading within the confines of an evolving bearish pennant. With no bullish fundamental triggers on the horizon, bearish Harmony One price predictions are set to emerge, especially if the pattern resolves as expected.
The Harmony Protocol team recently tweeted on the successful integration of their service by The Graph blockchain protocol. While this is expected to lead to more efficiency in data queries within the ecosystem, traders will have no care for this if the market sentiment remains bearish.
My Harmony One price prediction is currently bearish. Even if a near term rally invalidates the pattern, it will only provide a cheaper alternative in the future for resuming any bearish positions.
Harmony One Price Prediction
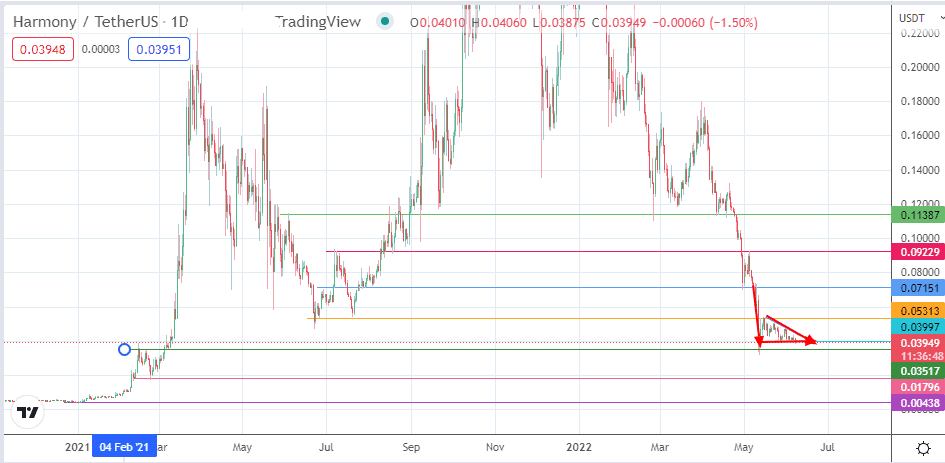
The daily chart shows an evolving bearish pennant, with the price action poised to test the lower border of this pattern at 0.03997. If the bears breach this level, an immediate challenge to the downside move will occur at the prior high of 14 February 2021 that now acts in role reversal.

This scenario indicates the potential for a push toward the low of 23 February 2021 at 0.01796 if this challenge is surmounted. The bears must degrade this support for the price action to attain the measured move from the pattern’s completion at 0.00438 (4 January 2021). This move sends the ONE/USDT pair near the all-time lows.
This outlook is negated if the price action bounces off the 0.03715 support. A push towards the 0.05313 resistance (15/22 May highs) breaks the pattern’s upper edge, thus invalidating it. A further advance requires a break of 0.05313, targeting the 28 July 2021 low at 0.07151. The 9 July 2021/4 May 2022 high at 0.09229.
ONE/USDT: Daily Chart