- The BAE Systems share price is hovering near its all-time high as demand for military systems remains at elevated levels.
The BAE Systems share price is hovering near its all-time high as demand for military systems remains at elevated levels. The BA stock price is trading at 766p, which is slightly below its all-time high of 783p. It has risen by almost 45% this year, becoming the best-performing stock in the FTSE 100 index. The firm’s market cap has risen to over 24 billion pounds.
BAE Systems is the biggest military company in Europe and seventh globally. The company manufactures fighter jets, armored multi-purpose vehicles, machine gun systems, and combat ships among many others. It has operations in countries like the US, Australia, India, and Saudi Arabia among others.
The BAE share price has done well as investors anticipate more demand following the Russian invasion of Ukraine. The impact is that many countries, especially those in Europe, will increase their defence spending. This is notable since the company’s business was growing even before the new crisis emerged. Its revenue rose from £20.8 billion in 2020 to £21.3 billion in 2021. Its net debt declined by over £600 million while its underlying EBIT rose to £2.2 billion.
However, like all industrial companies, BAE Systems is facing the challenge of rising costs as the prices of most inputs like steel and aluminum keeps rising. In the long-term, however, the company will likely benefit as commodity prices retreat and adjusted pricing remains intact.

BAE Systems share price forecast
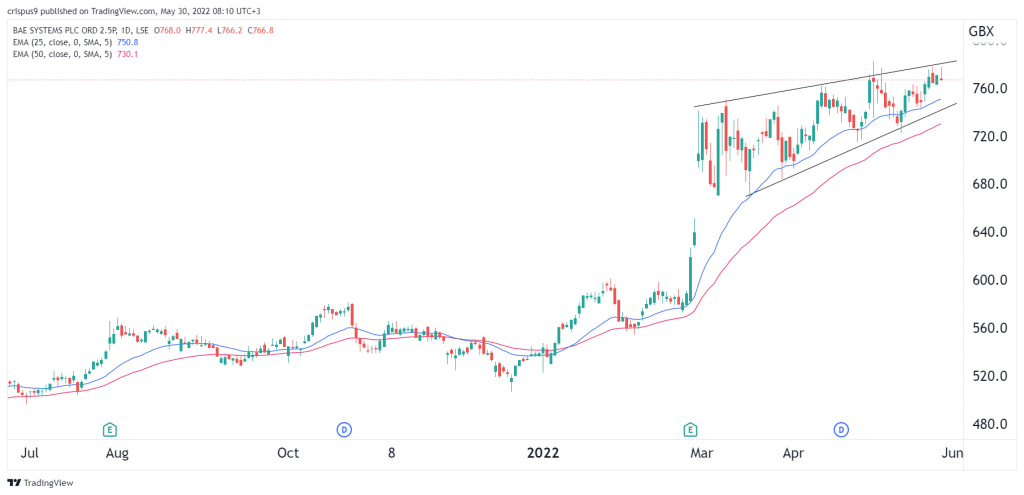
The daily chart shows that the BA share price has been in a strong bullish trend in the past few months. Recently, however, the stock has formed what looks like a rising wedge pattern that is shown in black. In most cases, a rising wedge is usually a bearish sign. The stock is still being supported by the 25-day and 50-day moving averages.
Therefore, while the bullish trend will likely keep rising, there is a likelihood that the stock will have a bearish breakout because of the wedge pattern. If this happens, the stock will drop to about 700p. A move above the resistance at 780p will invalidate the bearish view.