
- Aviva Share Price Forecast: LON: AV has failed to catch a bid despite a decent recovery in the UK stock market.
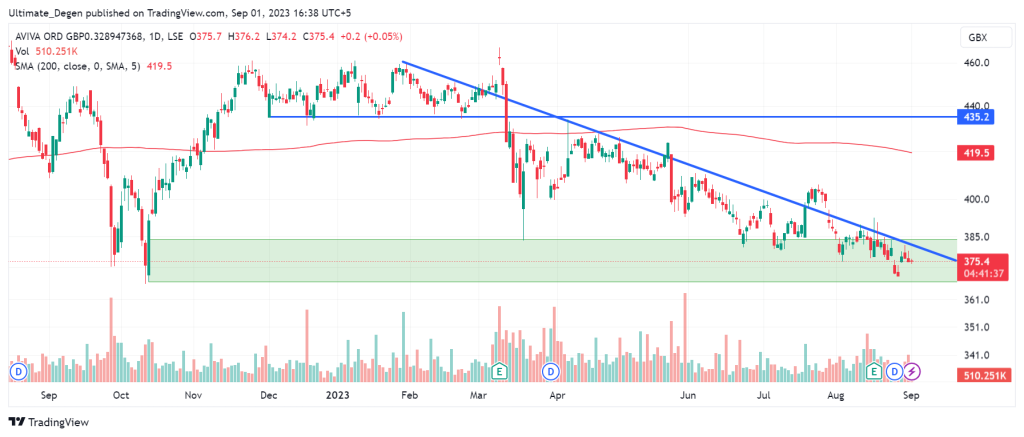
Aviva (LON: AV) share price is still trading inside the 367p-384p demand zone that I had identified in my previous analysis. The daily chart also shows the price respecting the downward trendline. The shares for the British insurance company are trading at 375.3p, up 0.03% at press time.
Usually, Investors use indices like the FTSE100 to understand market sentiment in the UK stock market. Some bullish sentiment is evident right now as the FTSE100 stood 210 points above last week’s low. However, Aviva shares were still down 1.5% from last week.
Aviva H2 Earnings Fail To Impress Investors
On 16th August, Aviva published their earnings report for the first half of 2023. The British asset manager reported an operating profit of £715 million, significantly more than the previous half-yearly profit of £661 million. Aviva also earned £5.27 billion in insurance premiums, £0.12 billion more than the expected 5.15 billion. Despite a positive earnings report, the stock kept tanking.
The CEO of Aviva cited the increasing inflation, supply chain issues, and the war in Ukraine as the reasons that led to an increase in insurance premiums. She also mentioned the British insurer’s interest in expanding into the London insurance market. Such an expansion could be bullish for the long-term growth of Aviva share price.
Aviva Share Price Trades In Critical Demand Zone
The price chart for LON: AV shows the price respecting the downward trendline since February. The price broke above the trendline 3 times before being put down by the bears. The demand zone of 367p-384p is very important, as I expect a bounce from there.
Aviva share price forecast may turn bullish if the bullish divergence on the RSI and MFI indicators plays out in the coming weeks. The price can target 200 MA if it breaks above the trendline drawn in the following chart. However, the outlook will flip bearish if the price breaks below the bottom of the green demand zone.
In the meantime, you are also welcome to follow me on Twitter to keep track of my personal trades and the latest analysis on Aviva stock.