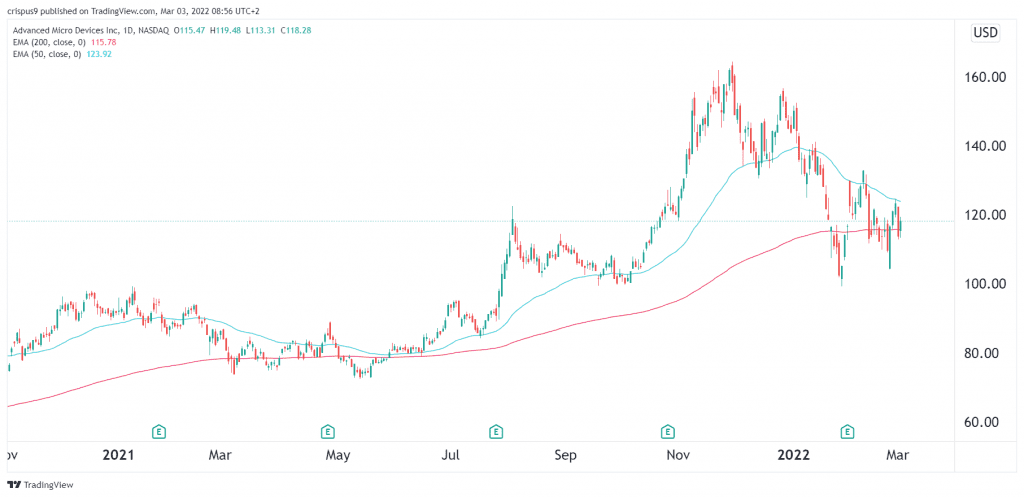
The AMD stock price has been in a tight range recently as investors assess the company’s growth prospects. The shares are trading at $118, which is about 27% below the highest point in December, meaning that it is in a bear market. It has even underperformed Nvidia, Intel, and the iShares Semiconductor ETF.
AMD is one of the leading semiconductor companies that has become a giant in its industry. The firm’s market cap of $192 billion is slightly below that of Intel, which was once the leading semiconductor firm in the world. This is partly because the company recently combined with Xilinx in a deal valued at almost $50 billion.
Latest news
AMD’s growth has been remarkable. For example, in terms of revenue, it made $16 billion in 2021 after making $9.7 billion in the previous year. In fact, its revenue in 2021 was bigger than what it made in 2019 and 2020 combined. Its net income has surged to over $3 billion. Most importantly, the company is quickly closing its gap with Intel in the CPU industry.
There are several reasons why the AMD stock price could keep rising even as the PC industry slows. First, the company’s combination with Xilinx will help it to accelerate its growth. Xilinx brought programmable chips that AMD did not have. Second, the data center segment will continue providing the necessary growth. Finally, the company is doing well to reward shareholders. It recently announced an $8 billion buyback that will lead to a higher EPS.
AMD stock price forecast
While AMD’s fundamentals are good, technicals don’t look promising. As shown below, the stock has already moved into a bear market. Along the way, it has crashed below the 50-day moving average. It is currently sitting at the 200-day moving average. A closer look shows that the stock has formed a head and shoulders pattern, which is usually a bearish signal.
Therefore, in the near term, we can’t rule out further retracement as bears attempt to push it below the key support at $100. This view will become invalid if the stock moves above $130.