

- The ADA price prediction indicates a further season of downside moves on the ADA/USDT pair as indicted by the S-R indicator.
The ADA price predictions remain bearish, even as the ADA/USDT pair is down for the 4th straight session amid continuing market decline. However, the price action is approaching recent support seen on 18 June at 0.4295. The daily chart indicates that the price picture may give the bulls some cause for worry. The price candles have started to consolidate within an evolving bearish flag.
A resolution of this flag will need the bears to take out this support and the 0.4002 psychological support. This may lead to a potential decline that could see the ADA/USDT pair reclaiming 18-month lows. The Investingcube S-R indicator has drawn up potential entry and exit points based on its ADA price prediction. Here is an explanation of the potential setups on the ADA/USDT pair.
ADA Price Prediction
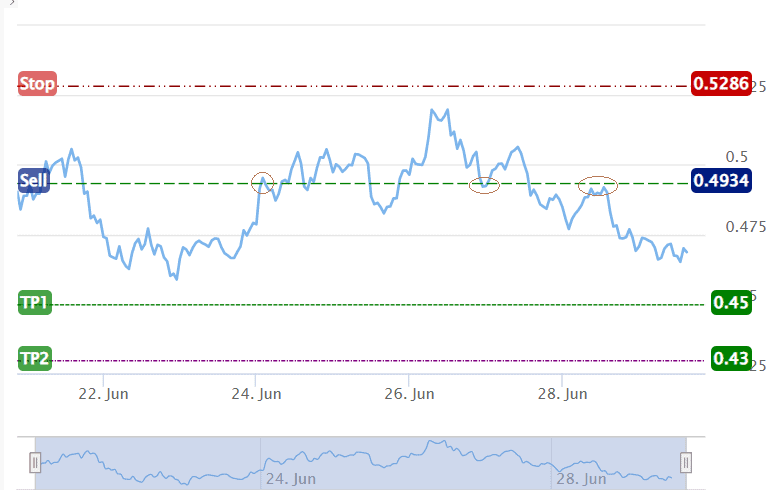
The Investingcube S-R indicator has an ADA price prediction for the downtrend to continue. However, a sell entry to follow this trend must allow for a pullback. The indicator has pointed to a potential entry position at 0.4934, with a stop loss at 0.5286 and two profit targets at 0.45 and 0.43.

The entry point is a price level where resistance was found earlier, on 24 June and also on 28 June. Further resistance is found at 0.528. A break above this level will invalidate the trade setup, which is why the stop is set at that point. A contrarian trade setup may wait for the breach of the 0.5280 resistance, following the advance toward a potential pitstop at the 17 May/2 June 2022 high at 0.5988.
Additional barriers to the north are seen at the 0.6500 psychological price mark and site of the 9 June high, and also at the 0.6829 price mark (31 May 2022 high). It should be noted that in a downtrend, a rally to any of these price marks may constitute price points at which downtrend resumption could occur.
ADA/USDT Chart