


- The S&P 500 index fails to break the 4480 price mark. Is this a sign that the rally has stalled? Find out in this anlysis piece.
The S&P 500 index opened lower despite upbeat US data that showed robust retail sales and a rise in manufacturing activity in the Philadelphia area. As of writing, the S&P 500 index was down by 0.62%.
Data from the US Census Bureau had shown a recovery in retail sales, with the headline and core number beating estimates by a wide margin in a reversal of fortunes for this metric. Still, the index could not build on this, resulting in a drop after failing to break the critical 4480 resistance.
The reason may not be unconnected by the rise in US long-term treasury yields, which rose more than 2% to build on the 1.56% gain in yields on the US 10-year Treasury note posted on Wednesday. As a result, capital flows away from the stock market and into the bond market have led to a selloff on the index. However, selling remains limited above the 4422 support.
S&P 500 Index Outlook
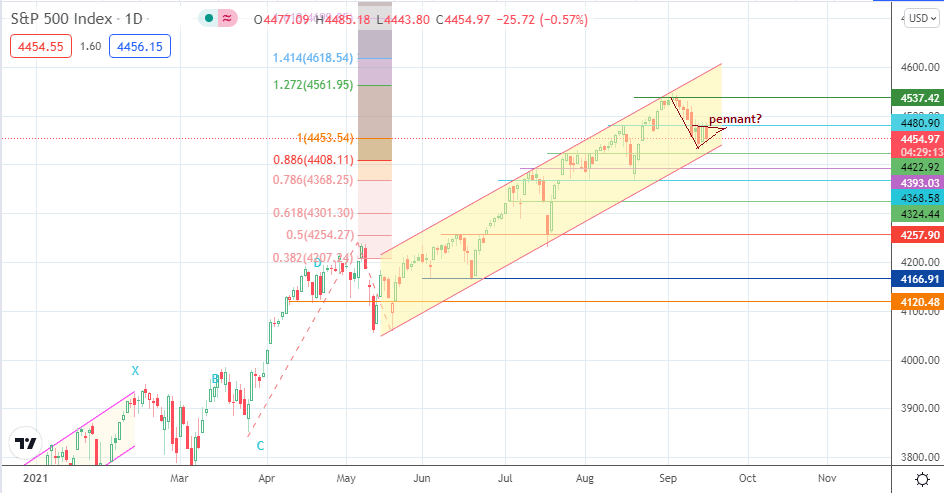
Thursday’s decline following the rejection and pullback from the 4480.90 resistance opens the door for the bears to target the 4422.92 support, along with the channel’s trendline. A breakdown of this double support allows 4393.03 to come into the picture, with 4368.58 and 4324.44 lining up as potential targets to the south. This view is supported by the evolving bearish pennant within the channel.

On the other hand, a bounce from the combined support at 4422.92 allows the bulls to retest the 4480.90 resistance. A break of this area clears the pathway for a retest of the 4537.42 resistance. If attempts to uncap this level are successful, new highs will be seen, with 4561.95 and 4618.54 (127.2% and 141.4% Fibonacci extension levels) becoming visible as potential upside targets.
S&P 500 Index: Daily Chart
Follow Eno on Twitter.