


- Discover the technical outlook for the S&P 500 after its rally amid US-China optimistic updates, additionally how is the Dollar index perform
Yesterday, stocks and the US dollar all increased in response to the announcement that the US and China had reached a trade deal.
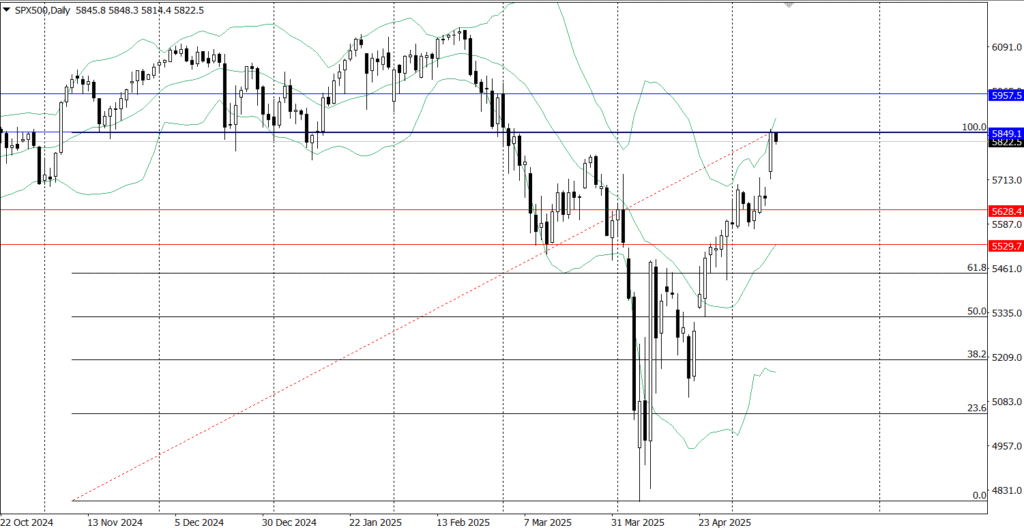
According to the S&P 500 Index (INDEXSP: .INX), the price swings were not as big as expected, however, the S&P 500 went above a good, strong price level yesterday. So let’s look at the potential bullish scenario and when it might be reached, and also the bearish scenario.
At the time of writing, the S&P500 is holding under the pressure of the strong resistance level at $5849.1, any breakout above this level may open the door for the index to reach higher levels and confirming the bullish scenario.
On the other hand, if the index remains under the mentioned resistance level and places a clear daily close under $ 5780, this may confirm the bearish scenario.
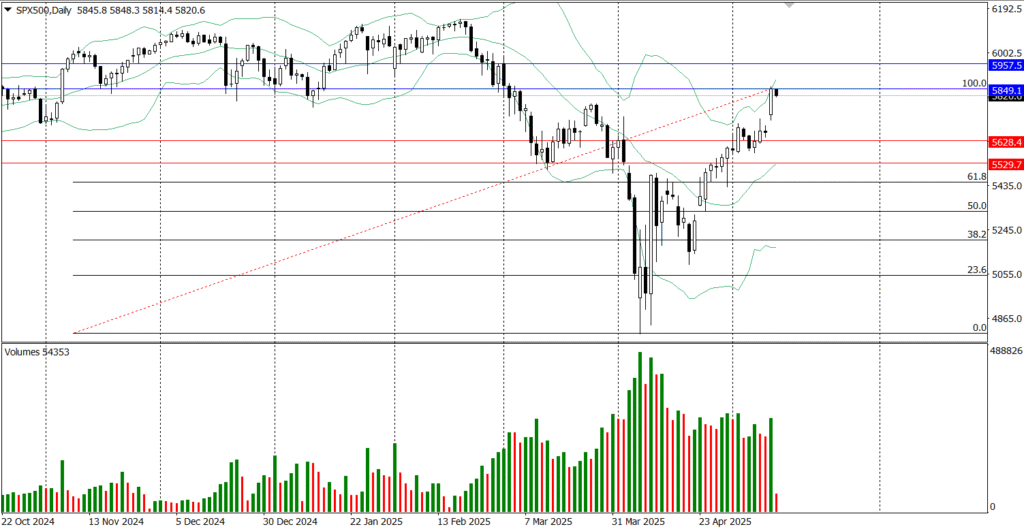
However, we won’t confirm anything for a few days as long as the volumes are not impressive in the S&P 500. And also the S&P 500 Future had fallen by 25 points, which is 0.4% by 07:33 GMT. S&P 500 Rebounds Off Lows After Tariff Meltdown
The US-Dollar Index Price Forecast
This index measures the value of the US Dollar against a basket of six world currencies, retreated from its highest level since 10th April to reach 101.60 today early morning. In response to the optimistic announcement of the trade deal between the U.S. and China, it supports the U.S. dollar.
Technically, the US dollar index still suggests the bearish sentiment, because the index has not confirmed yet a solid bullish sentiment above the psychological level at 100.00, so any break down this level could expose 99.23, the low of May 7, and the next target to watch is 98.02, the low of April 22.
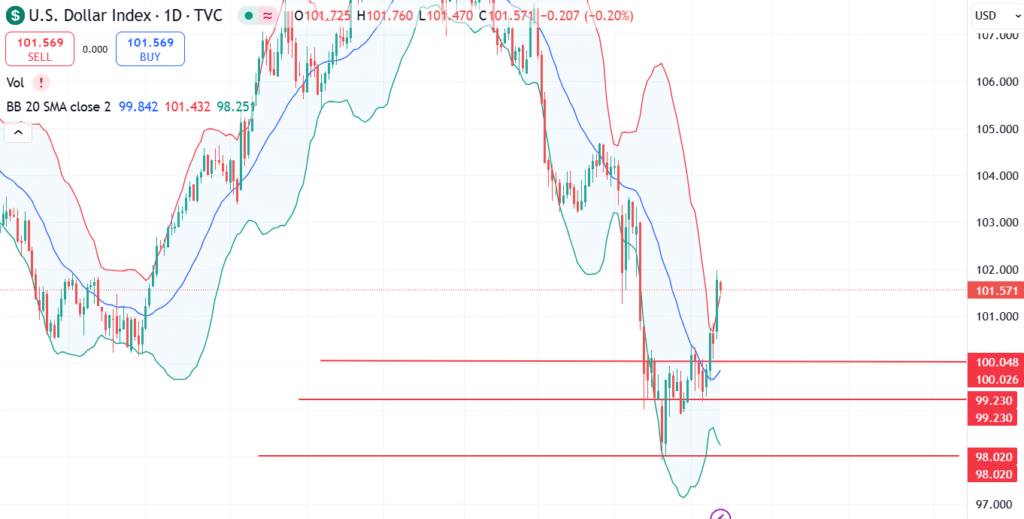
On the bullish side, if the index places a clear day close above the resistance level at 103.35, it could expose it to reach additional higher levels at 104.31, and extended gains could reach 104.71, the high of March 27.
📊 S&P 500 Key Technical Levels (as of May 13)
Fair Value: +$18.50
Buy Programs: +$22.50


Sell Programs: -$14.75
Key Pivot Zone: 5825 to 6188 range.
Support Levels: Numerous detailed — major support begins below 6000 (e.g., 5988.2, 5951.2, 5916.2, 5897).
Market Insight: These technicals guide institutional buy/sell triggers — useful for short-term trading setups.