The South African rand retreated modestly against the greenback this week. After falling to a multi-month low of 16.72 this week, the USD/ZAR exchange rate pulled back to a high of 17.31. The pair reacted to a data dump from the US that included retail sales, producer price index (PPI), and jobless claims. South Africa also published relatively strong inflation data.
What happened?
The USD/ZAR pared back some of the gains it made last week after the US published weak retail sales numbers. In the aftermath to these numbers, several Federal Reserve officials maintained that the Fed will need to maintain its hawkish tone in the next few months.
Meanwhile, in South Africa, data showed that the country’s inflation edged downwards in December. The headline CPI dropped from 7.4% to 7.2% while core CPI dropped to 4.9%. These number imply that the South Africa Reserve Bank (SARB) will likely go slow on rate hikes in 2023. It delivered a series of hikes in 2022 that pushed the headline rate to 7%. My view is that the bank will deliver about 2 rate hikes in the first half of the year and then cut by 1 in Q4.
USD/ZAR daily chart analysis
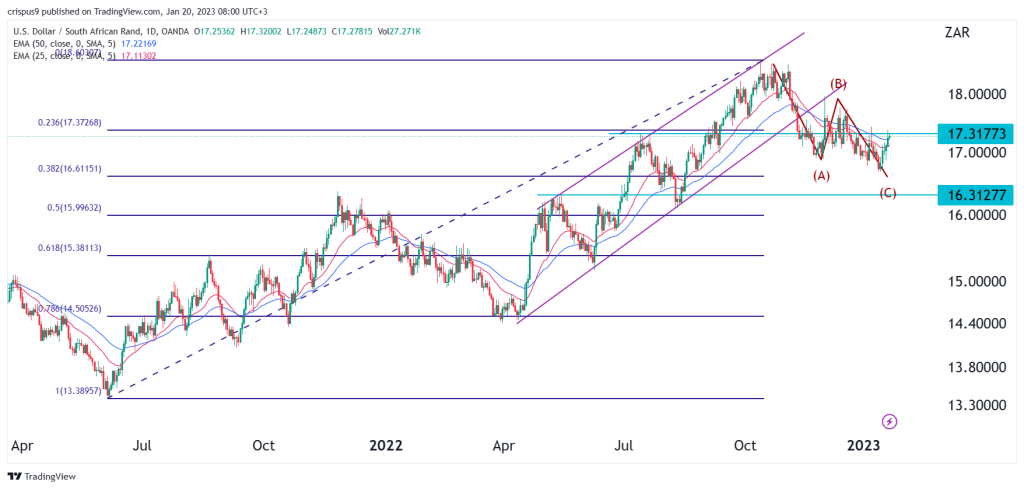
The USD to ZAR price was in an overall bullish phase starting from May 2022. As it rose, it formed an ascending channel shown in purple. It successfully made a bearish breakout below the lower side of that channel on November 10 and then retested it on December 1. As it rose, the pair made a full impulse Elliot wave pattern.
It is now forming the collective wave of the Elliot wave pattern and has moved to the 23.6% Fib level. Therefore, I believe that the overall outlook of the USD to rand pair is still bearish, with the next target to watch being at 16.31, the highest point on May 12. This price is between the 50% and 38.2% Fibonacci Retracement level.
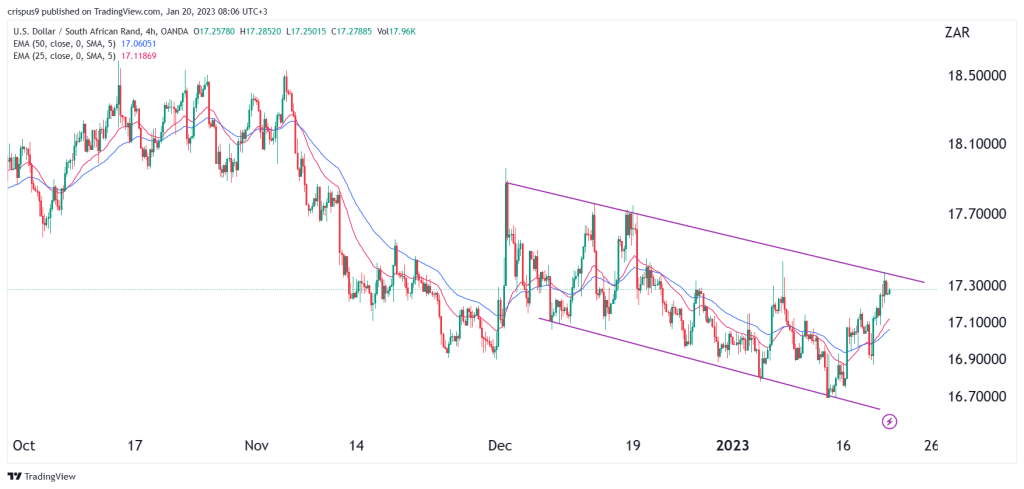
USD to ZAR 4H chart analysis
The USDZAR rebound on the 4 chart has seen it approach the upper side of the descending channel. When such a pattern happens, there are usually two scenarios. First, the pair could move above the descending channel and continue the bull run. On the other hand, it could move lower as sellers target the lower side of the channel.
Based on the price action on the 1D chart, I am inclined to believe that the latter will happen. This is where the pair retests the lower side of the channel at about 16.70. Of course, this view will become invalid if it moves above the resistance at 17.50.