As the US dollar recoils, the USD/SGD price has been in a strong bearish trend in the past few weeks. The USD to SGD price was trading at 1.3785 on Wednesday morning, which was about 2.2% below the highest point in July this year. This price is close to the lowest level in July 2022.
USD/SGD latest news
The USD to Singapore dollar exchange rate has declined sharply in the past few weeks. The sell-off coincided with the sharp decline of the US dollar. The dollar index retreated from the year-to-date high of over $109.30 to the current $105.3.
The dollar sell-off coincided with the sharp decline of American bond yields. The yield of the 10-year government bond declined to 2.7%, while that of the 30-year bond fell to 3%. This decline happened even after the US published strong jobs numbers and the Federal Reserve remained adamant that it will hike interest rates in the coming months.
Data published in July showed that the American economy added over 528k jobs in July of this year. That increase was better than the median estimate of 250k. The unemployment rate dropped to 3.5%, while the labour participation rate moved up slightly.
The USD/SGD price will react to the latest US inflation data that will come out on Wednesday. Analysts expect the data to show that the country’s inflation dropped slightly in July as the cost of gasoline fell during the month.
Still, America’s inflation will remain substantially above the Fed target of 2.0%. Therefore, the bank will likely continue hiking interest rates in the coming months. The Fed has already hiked interest rates by 225 basis points this year. Expectations are that it will hike by 0.50% in September and then by 0.25% in the final two meetings of the year.
Monetary Authority of Singapore and Asian tensions
Meanwhile, the pair also reacted to the Monetary Authority of Singapore (MAS) actions. The agency has been progressively tightening monetary policy in the past few months as the economic recovery consolidated and inflation rose.
MAS has tightened by increasing the rate of appreciation of the Singapore dollar nominal exchange rate band. This is usually the most effective way for MAS to intervene in the financial market.
At the same time, the USD/SGD pair has retreated as investors focus on the rising tensions in Asia after last week’s trip to Taiwan by Nancy Pelosi. Since then, China has increased its military activity, and there are risks of war. So to a large extent, Singapore will likely benefit as more companies avoid China in the coming months.
USD/SGD chart analysis
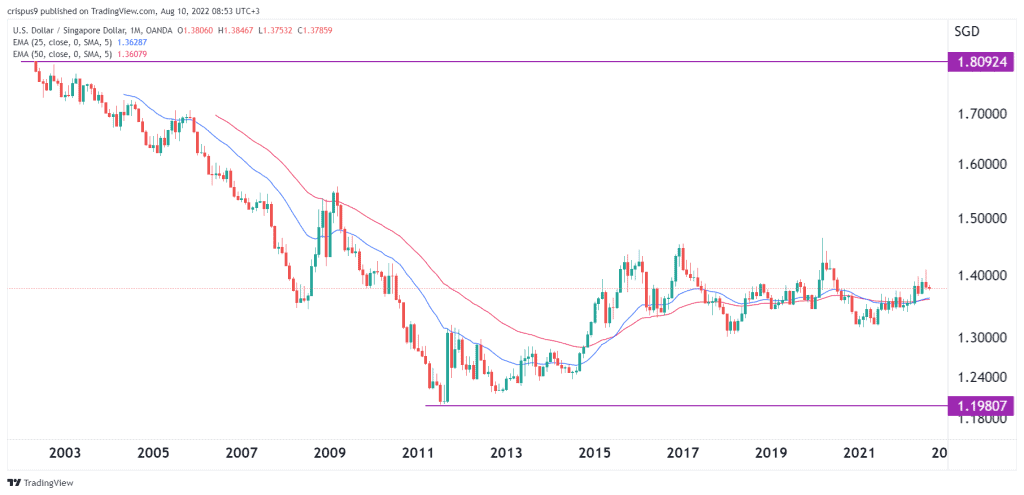
The chart below shows that the USD/SGD price has been in a strong bearish trend in the past few decades. After peaking at 1.8092 in May 2002, the pair crashed and reached a low of 1.1980 in June 2011. This 33% decline coincided with a period when Singapore saw a significant increase in business activity. Singapore is a major technology, industrial, and energy hub in Asia.
In the past few years, however, the USD to SGD exchange rate has attempted to pare back some of those losses. It is now trading at 1.3788, which is about 15.18% from the lowest level in 2012. However, the price is also about 5% above the lowest level in 2021.
Is USD/SGD a good investment?
The USD/SGD price has not been a good investment in the past few years. It has remained between support at 1.2994 and 1.4530 since November 2015. This performance pales that of other emerging market currency pairs that have surged in the past few years. For example, the USD/TRY price has jumped by over 70% in 2022 alone.
USD/SGD buy or sell – technical analysis
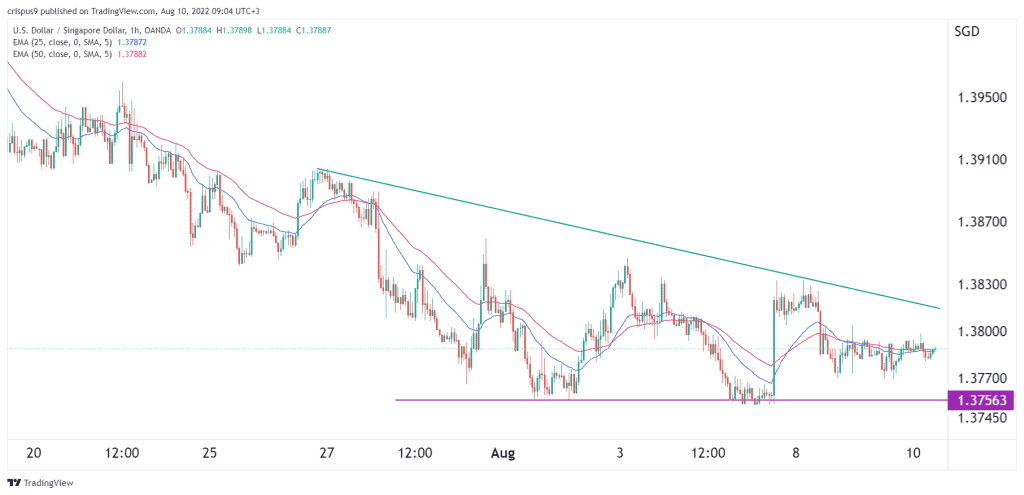
The hourly chart shows that the USD to SGD exchange rate has been in a tight range in the past few days. However, the pair has been in a downward trend in the past few weeks. It remains below the descending trendline shown in green. It has also formed important support at 1.3753, where it struggled to move below in July.
Therefore, at this point, we believe that the USDSGD price will have a bearish breakout since it has formed what looks like a descending triangle pattern. However, this view will be invalidated if the price manages to move above the falling trendline.
USD/SGD Forecast 2023
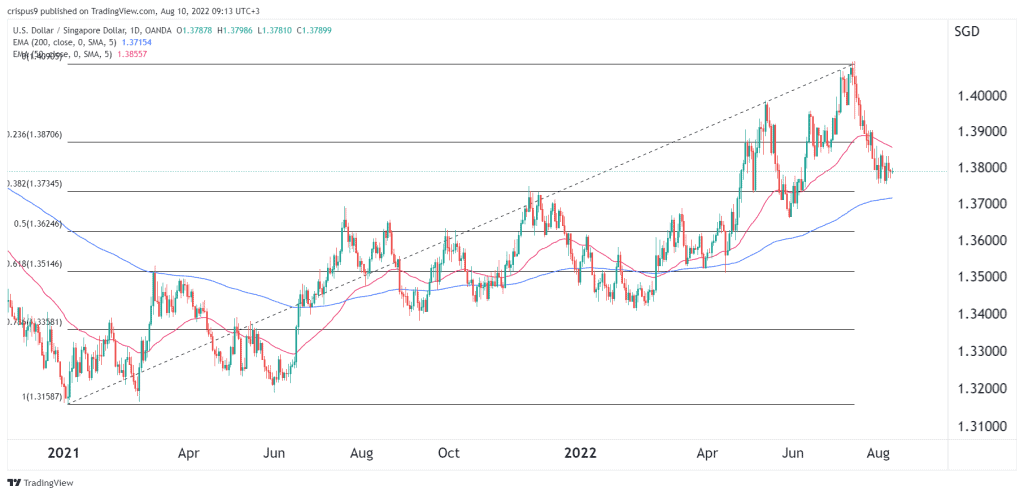
The daily chart shows that the USD/SGD price has been in a bullish trend in the past few months. The pair has recently crashed as MAS focuses on tightening interest rates. The pair has managed to move below the 23.6% Fibonacci Retracement level.
At the same time, it has dropped below the 50-day moving average, and there is a likelihood that a death cross will happen. Therefore, the pair will likely continue falling in 2023 and reach the key support level at 1.3600.
USD/SGD forecast 2025
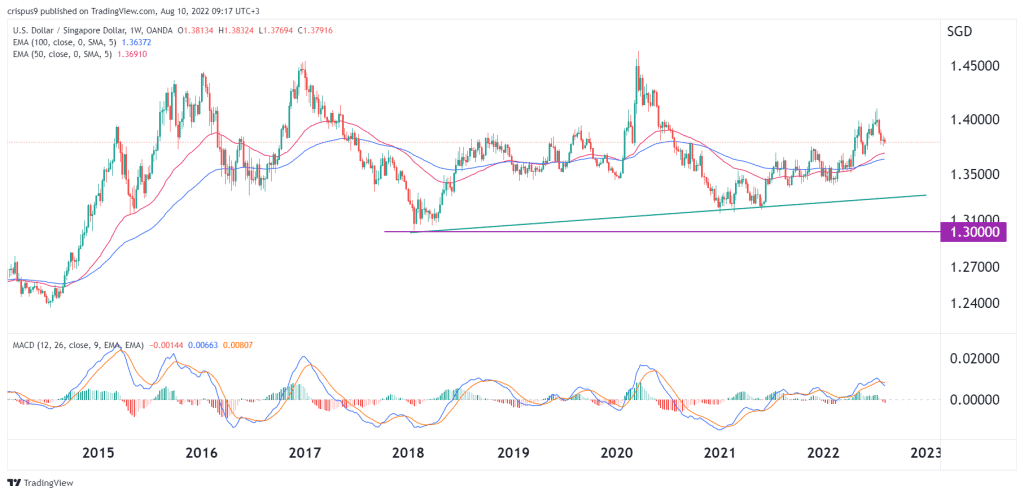
The weekly chart shows that the USD/SGD price has formed a head and shoulders pattern. In price action analysis, this pattern is usually a bearish sign. It remains slightly above the 50-day and 100-day moving averages while the MACD has formed a bearish crossover.
The head and shoulders pattern in price action analysis is usually a bearish sign. Therefore, the pair will likely continue falling as sellers target the next support at 1.300.
USD/SGD forecast 2030
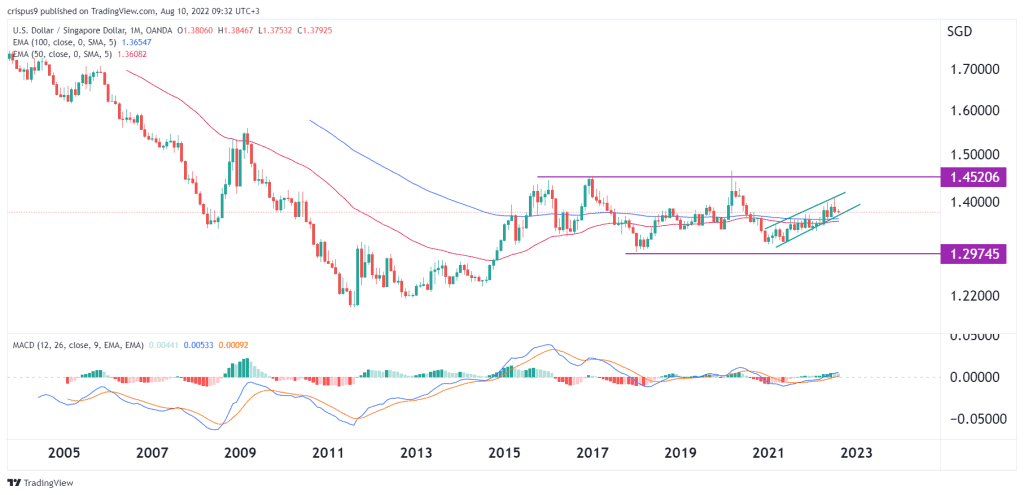
Predicting where the USD/SGD price will be in 2030 is a bit tough. For example, no one knows the major challenges or opportunities that will emerge by then. The monthly chart shows that the USD to SGD exchange rate has been in a bullish trend in the past few months. Along the way, it has formed a small ascending channel pattern shown in green. It has also crossed the 50-month and 100-month moving averages. The MACD has moved above the neutral level.
Therefore, the pair will likely have a bearish breakout, with the next key support being at about 1.2800 in 2030. A move above the resistance at 1.4520 will invalidate the bearish view.